
Join Our Telegram channel to stay up to date on breaking news coverage
The Fantom price prediction shows that FTM is gaining more strength as the coin crosses above the moving averages.
Fantom Prediction Statistics Data:
- Fantom price now – $0.55
- Fantom market cap – $1.4 billion
- Fantom circulating supply – 2.7 billion
- Fantom total supply – 3.1 million
- Fantom Coinmarketcap ranking – #41
FTM/USD Market
Key Levels:
Resistance levels: $0.70, $0.75, $0.80
Support levels: $0.40, $0.35, $0.30
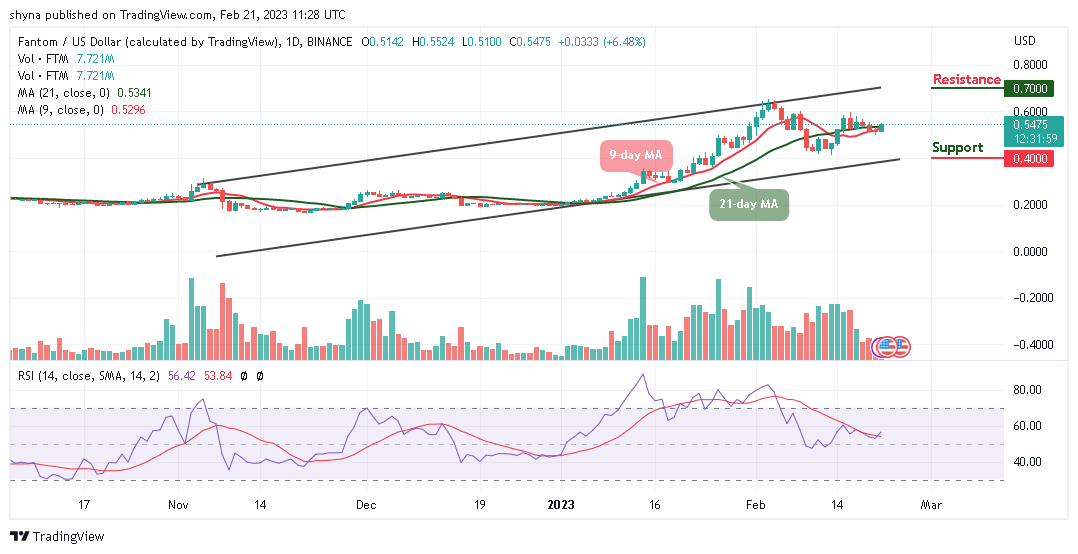
FTM/USD may continue to refresh to the upside as the coin currently trades at $0.54 with a bullish crossover and trend intraday. Today, the Fantom price is likely to face the upper boundary of the channel as higher resistance may come in the next positive direction.
Fantom Price Prediction: Fantom Price May Spike to the Upside
The Fantom price is likely to increase the bullish movement if the price increases and heads toward the upper boundary of the channel. At the moment, the technical indicator Relative Strength Index (14) is likely to cross above the 60-level; and it could send bullish signals into the market to encourage more buyers.
Meanwhile, if the 9-day moving average crosses above the 21-day moving average, it is for the confirmation that the coin will head to the north, and the price could hit the nearest resistance levels at $0.70, $0.75, and $0.80 respectively. On the contrary, if the technical indicator Relative Strength Index (14) slides below the 50-level, there may be a little retreat to the south, which could bring the market price to the support levels of $0.40, $0.35, and $0.30.
Against Bitcoin, Fantom (FTM) may cross above the 9-day and 21-day moving averages as the price heads to the upside. Meanwhile, the fact that the market keeps moving in the same direction within the channel, the crypto is likely to form a bullish movement if the technical indicator Relative Strength Index (14) moves to cross above the 60-level.
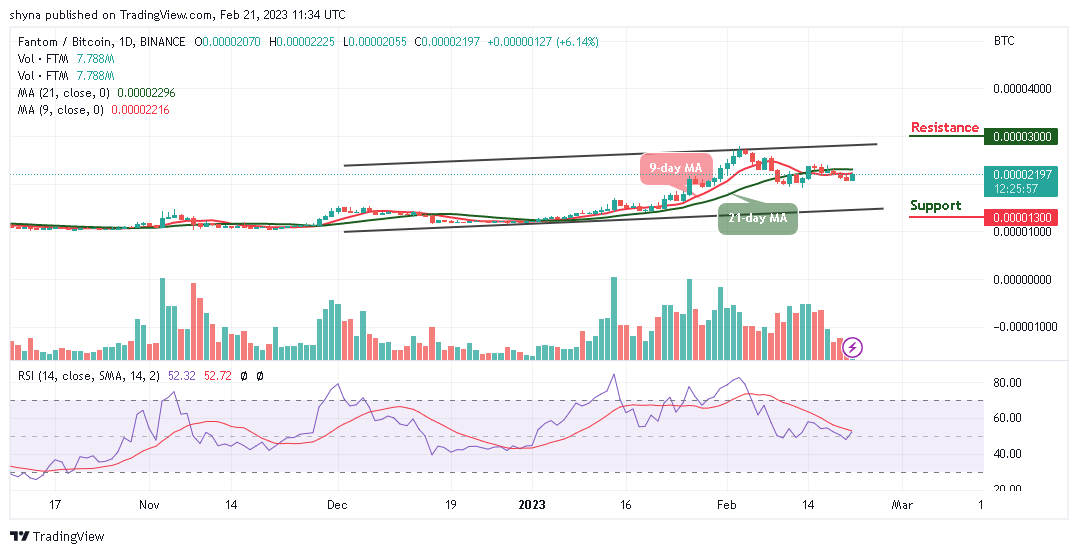
Nevertheless, if the buyers push the market price towards the upper boundary of the channel, crossing above this barrier could hit the resistance level of 3000 SAT and above. Meanwhile, traders should watch out for any strong selling pressure which could bring the price below the lower boundary of the channel, this could attract new sellers coming into the market with the next focus on the support level of 1300 SAT and below.
Fantom Alternatives
At the time of writing, the Fantom price is trading bullishly and it may continue to move upwards if the price crosses above the upper boundary of the channel. Nevertheless, the FGHT token is at the center of Fight Out’s ecosystem. It is an ERC-20 token built on Ethereum’s network and there has already been close to $5 million raised during the Fight Out presale.
Join Our Telegram channel to stay up to date on breaking news coverage