Join Our Telegram channel to stay up to date on breaking news coverage
Bears may dominate Fantom Market
The breakdown of $0.21 support level will decrease the Fantom to $0.20 and $0.19 levels. A breakup of the resistance level of $0.22 will increase the price to $0.25 and $0.26 levels.
Fantom Price Analysis – October 09
FTMUSD Market
Key levels:
Resistance levels: $0.22, $0.25, $0.26
Support levels: $0.21, $0.20, $0.19
FTMUSD Long-term Trend: Bearish
Fantom is on the bearish movement in daily chart. The sellers still holds tight to the Fantom market. Price remains below the two EMAs as a signal of bearish market. Though there was no significant movement in the market as there is low momentum in the buyers and sellers’ activity. The coin is struggling to break down the support level of $0.21 at the moment.
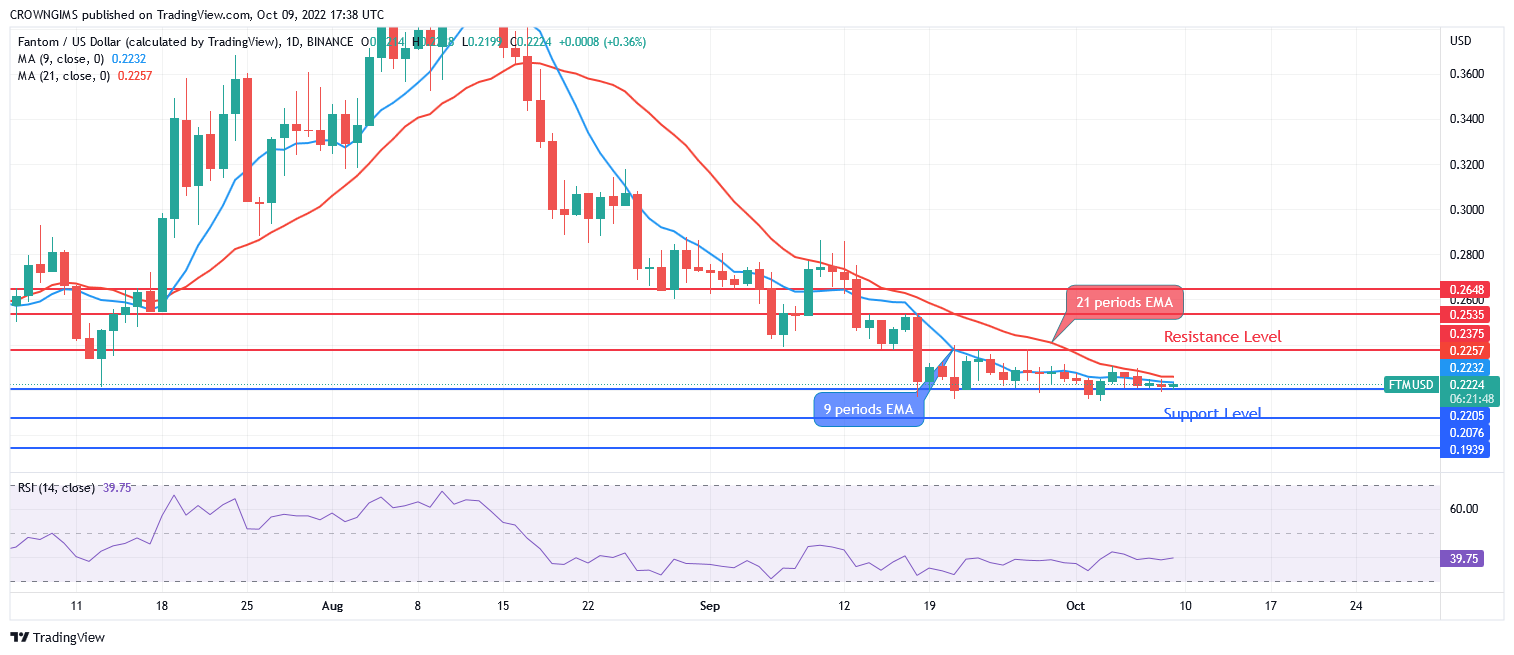
Fantom price is trading below the 9 periods EMA and 21 periods EMA at close distance indicating low momentum. The relative strength index period 14 is at 39 levels with the signal line displaying no specific direction. The breakdown of $0.21 support level will decrease the price to $0.20 and $0.19 levels. A breakup of the resistance level of $0.22 will increase the price to $0.25 and $0.26 levels.
Your capital is at risk
FTMUSD Medium-term Trend: Ranging
Fantom is on the ranging movement in the medium-term outlook. The crypto continues it’s ranging movement within the resistance level of $0.22 and support level of $0.21. Bears’ momentum is low and unable to penetrate the mentioned support level. The bulls’ pressure is not enough to break up the resistance level of $0.22. Ranging movement continues until there is a breakout.
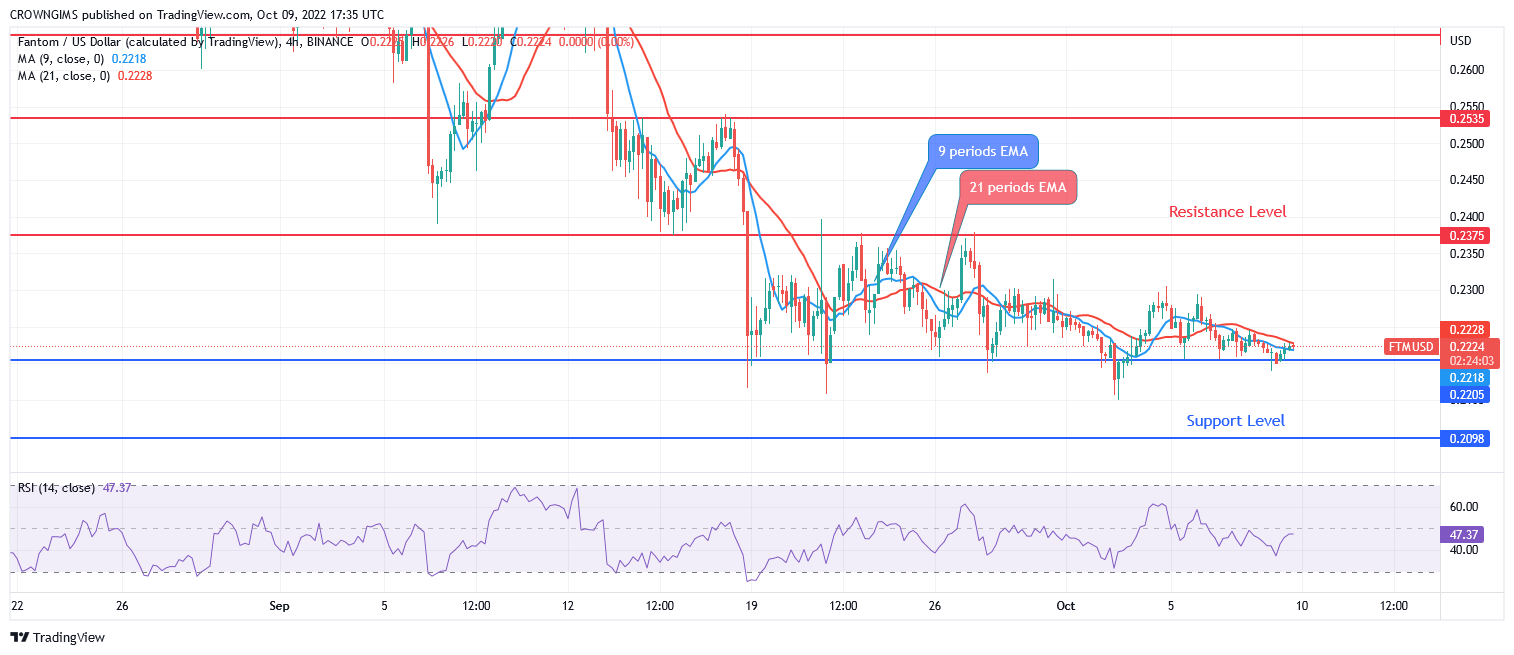
The two EMAs are locked to each other and the price is hovering over the two EMAs, indicating a ranging market. The Relative Strength Index period 14 is at 45 levels and the signal line pointing down which indicate a sell signal.
Join Our Telegram channel to stay up to date on breaking news coverage