Join Our Telegram channel to stay up to date on breaking news coverage
Despite facing recent challenges due to enforcement actions by the U.S. Securities and Exchange Commission (SEC), the crypto market has demonstrated resilience by recording a 0.69% gain in the last 24 hours.
Major cryptocurrencies, including Ethereum, have capitalized on the current bullish trend. This is evidenced by the emergence of a golden cross between Ethereum’s 50-week and 200-week moving averages.
Could this be an optimal time to buy the asset, as the forms suggest that Ethereum may experience a significant surge in the coming months?
Ethereum Price Surges Along With the Market Rally
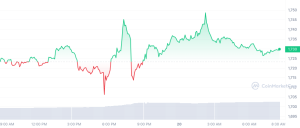
At press time, the $ETH token is trading at $1,729.42, with a rise of 0.38% in the last 24 hours.
With a trading volume of $5 billion in the last 24 hours, the Ethereum network’s coin is currently experiencing a bullish trend. The asset shows a slight 0.02% upward movement in the last hour, signaling an ongoing rally.
However, a closer look at $ETH’s performance over a shorter period reveals some weaknesses as it strives to recover from recent declines.
In the past seven days, its price has experienced a decrease of 0.71%, and within the last month, it has witnessed a 4.90% decline.
Nevertheless, Ethereum’s year-to-date (YTD) performance remains positive, with a healthy increase of 44.65%.
Based on the technical charts, the recent uptrend has not yet had a significant impact on the price of $ETH.
The current price of the digital asset falls slightly below its 50-day simple moving average (SMA) of $1,729.67 for the short term, while its 200-day simple moving average (SMA) of $1,731.14 for the long term.
While there is a possibility of a continued decline in the value of $ETH, investors should anticipate price fluctuations between the 50-day and 200-day SMA.
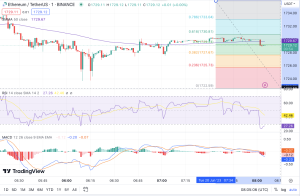
Technical analysis shows that $ETH encountered resistance at the 50% Fibonacci retracement level of $1,729.24. However, if the bullish trend persists, there is potential for the asset to surpass this point and move toward new price levels.
Despite this resistance, $ETH demonstrates strength in its oscillators. The relative strength index (RSI), currently at 27.26, indicates an oversold position, suggesting a potential recovery in the near future.
Unsurprisingly, the moving average convergence divergence (MACD) displays a weak sell view.
$ETH Chart Reveals Golden Cross Formation
Analysts have observed a recent bullish signal in the market, with Ethereum ($ETH) forming a weekly golden cross.
This signifies a positive trend where the short-term moving average surpasses the long-term average, a situation not witnessed since 2019.
Notably, this golden cross follows a previous death cross, reversing a long-term sell signal into a buy signal.
A golden cross occurs in a two-moving average system when a buy signal emerges due to the intersection of the shorter timeframe with the longer timeframe. On the contrary, when the opposite crossover occurs, it is referred to as a death cross.
With all the noise in the market right now, everyone has entirely missed the fact #Ethereum has formed a weekly golden cross pic.twitter.com/ylNwp3DEUI
— Tony "The Bull" Severino, CMT (@tonythebullBTC) June 12, 2023
In a chart shared by crypto analyst Tony “The Bull on Twitter, the golden cross formation clearly illustrates a significant development, with the short-term average of $ETH surpassing its long-term average after a prolonged period.
This occurrence indicates that the altcoin is in the early stages of a new bullish cycle. However, considering the ongoing regulatory turbulence affecting the market, it might take several months before this anticipated cycle becomes evident.
As a result, investors currently have an opportunity to purchase $ETH at a substantial discount before it enters another phase of consistent growth.
Given Ethereum’s strong fundamentals, significant surges in its price are expected soon.
Historical data shows that the appearance of the golden cross has led to Ethereum’s price soaring by an additional 680% before reaching its peak.
For instance, when $ETH last surpassed both moving averages in 2020, it experienced a rally of over 1,700%.
Explore Utility-Driven $ECOTERRA Token as $ETH Alternative
Following the legal conflicts between the SEC and popular cryptocurrencies, investor attention is shifting towards $ECOTERRA, the ecoterra platform’s utility token, as a viable substitute for $ETH.
Ecoterra is a green initiative that utilizes the recycle-to-earn (R2E) system, providing opportunities for individuals and businesses to earn rewards through recycling activities.
The platform encompasses various components, including a carbon offsetting marketplace, a marketplace for recycled materials, and a traceable impact profile.
🌱♻️ Unlock a world of rewards with ecoterra! #RecycleToEarn tokens that grant access to exclusive events, and green education platform 🌍💚
Join our #Presale today ⬇️https://t.co/1fYkPOsPYG#Crypto #Web3 #CryptoPresale #EcoCrypto #DeFi #Decentralised #Cryptocurrency pic.twitter.com/sp6KDZ5PUL
— ecoterra (@ecoterraio) June 20, 2023
By leveraging the Ethereum blockchain, ecoterra ensures the secure and transparent implementation of the Recycle 2 Earn concept on a large scale.
We have successfully reached the impressive milestone of $5.2 MILLION! 🎉🚀
Thank you to everyone who has supported us, and let's continue to make a positive impact together 💪💚https://t.co/1fYkPOsPYG#MilestoneAchieved #Presale #CryptoPresale #Presale #CryptocurrencyNews pic.twitter.com/84ThCoH8Sm
— ecoterra (@ecoterraio) June 20, 2023
Its $ECOTERRA token serves multiple purposes, such as distributing rewards, facilitating staking, and more.
The digital asset has reached a milestone in its presale of the native, surpassing over $5.23 million. The presale has now entered its eighth stage, and investors can purchase the $ECOTERRA token at $0.00925.
Related News
- Anticipating ARB Price Reversal: Ethereum Network Upgrade and Surge in Arbitrum Active Users
- Ethereum Validators May Stake Up To 64X More ETH Moving Forward
- Top Crypto Gainers on 19 June: SHIB, KAVA, XRP, DOT, Ecoterra, Deelance, AiDoge, And Launchpad XYZ
Join Our Telegram channel to stay up to date on breaking news coverage