Join Our Telegram channel to stay up to date on breaking news coverage
ETH Hikes Relatively – September 17
An energy-measuring trading indicator demonstrated that the ETH/USD market builds energy around the $1,500 line. In the last seven days’ operations, the price has maintained, featuring between $1,415.04 and $1,784.50, representing low and high values. Presently, the market carries a minute positive percentage rate of 0.44.
Ethereum (ETH) Statistics:
ETH price now – $1,440.62
ETH market cap – $176.3 billion
ETH circulating supply – 122.4 million
ETH total supply – 122.4 million
Coinmarketcap ranking – #2
ETH Hikes Relatively: ETH Market
Key Levels:
Resistance levels: $1,750, $2,000, $2,250
Support levels: $1,250, $1,050, $850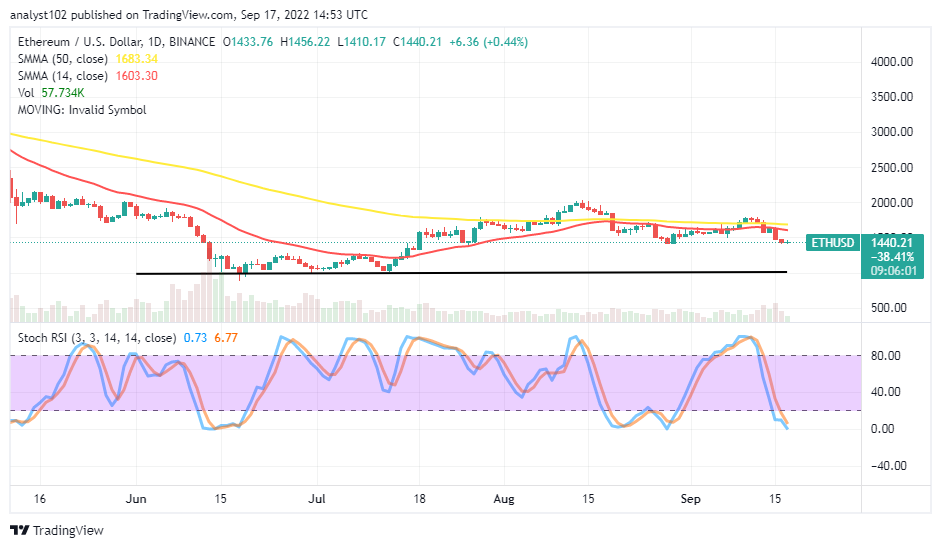 ETH/USD – Daily Chart
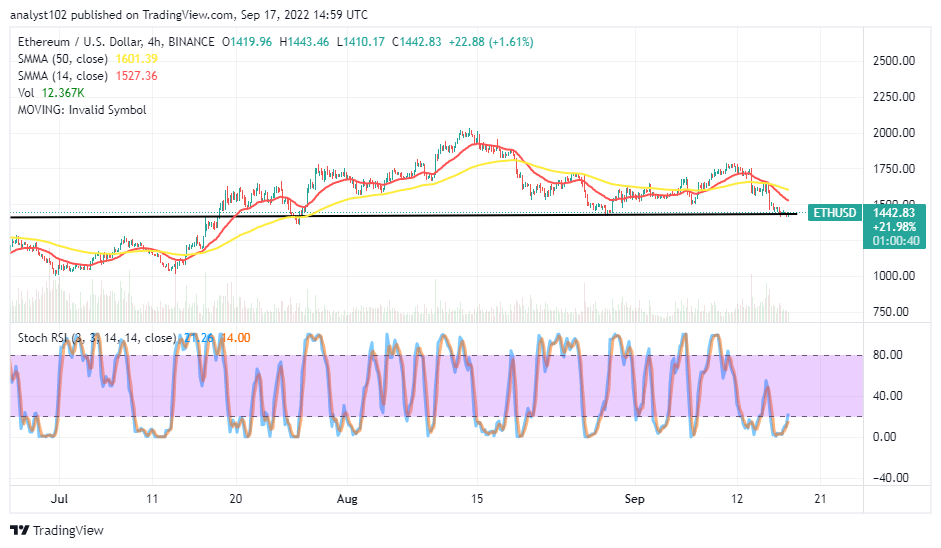
The ETH/USD daily chart showcases the crypto economy builds energy around the $1,500 trading level. The tendency of that assumption, coming out to a successful stage, has been confirmed by the reading of the Stochastic Oscillators, which shows 6.77 and 0.73 range points in the oversold region presently. The 14-day SMA indicator is at $1,603.30, closely underneath the 50-day SMA indicator, which is at $1,683.34. The horizontal line remains drawn at the $1,000 support level.
Your capital is at risk.
Can pull-downs be sustained below the ETH/USD market operations at the $1,500 level?
Going by the current reading status outcome of the Stochastic Oscillators in the oversold region, it is technically unstable to project sustainable pull-downs below the $1,500 level as the ETH/USD market builds energy around the value line. Buying activity may have to be at this moment on a lighter mode. Investors have to hold their positions firmly, or they can add parts to their portfolio on either a short or medium-term basis to run over the trend lines of the SMAs before catching out afterward.
On the downside of the technical analysis, the gravitational pressure to the downside of the $1,500 level has been less-active. And that could give in back to the moves in opposite in no time. Therefore, short-position placers have to take to trading principles of cautiousness at this point to avoid unnecessary bear traps. Sellers may need to wait for another round of the Stochastic Oscillators reading condition in an overbought region to re-consider the launching of a sell order.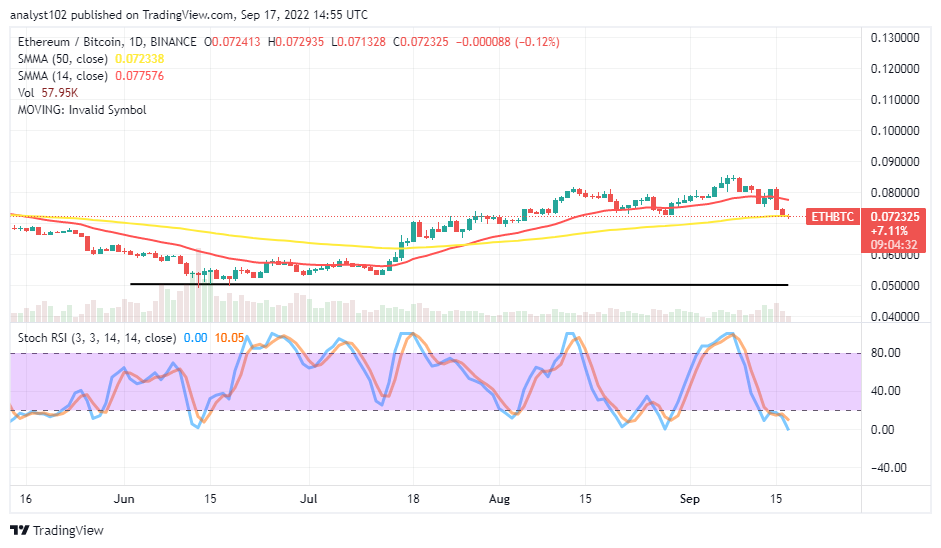
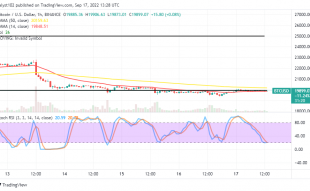
ETH/BTC Price Analysis
Ethereum has run in a correction mode against Bitcoin to a support point around the bigger SMA’s trend line. In other words, the cryptocurrency pair price builds energy around the 50-day SMA indicator, which is underneath the 14-day SMA indicator. The Stochastic Oscillators are in the oversold region, maintaining the range values of 10.05 and 0.00. That situation portends the base crypto tends to stop debasing significantly against its counter-trading crypto in no time.
Read more:
- How to buy Ethereum
- How to buy cryptocurrency
Join Our Telegram channel to stay up to date on breaking news coverage