Join Our Telegram channel to stay up to date on breaking news coverage
The Ethereum price prediction shows that ETH is moving above the $1,000 level, and it is currently changing hands at $1,048.
Ethereum (ETH) Statistics Data:
- Ethereum price now – $1048
- Ethereum market cap – $127.1 billion
- Ethereum circulating supply – 121.2 million
- Ethereum total supply – 121.2 million
- Ethereum Coinmarketcap ranking – #2
ETH/USD Market
Key Levels:
Resistance levels: $1900, $2000, $2100
Support levels: $170, $150, $130
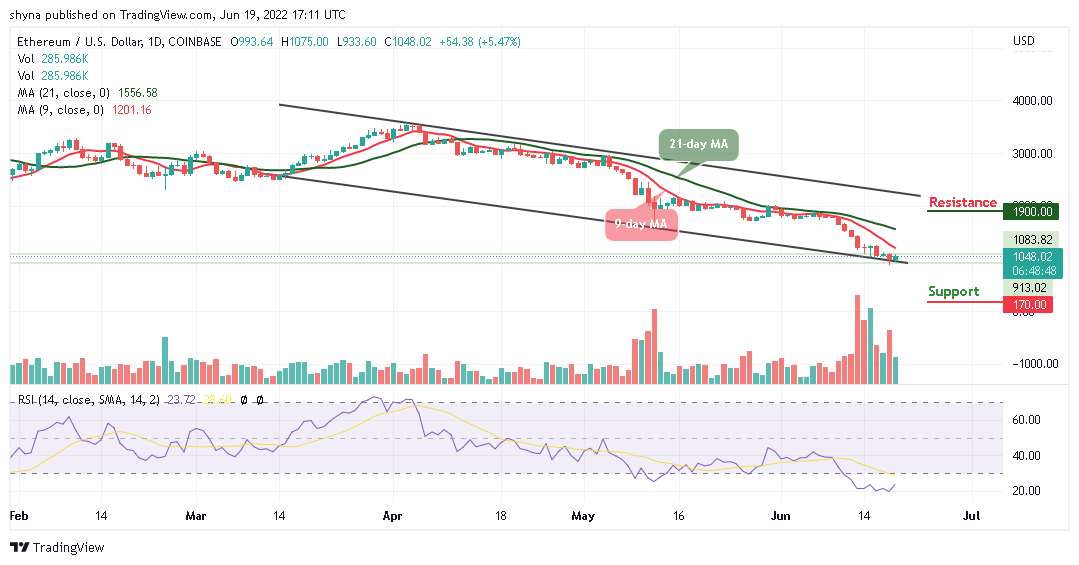
ETH/USD has once again traded above the $1075 mark as the number two crypto faces the path of development. For the past few weeks, the Ethereum price has been following the bearish movement as the coin heads to the south. At the moment, the Ethereum price is hovering below the 9-day and 21-day moving averages at $1048 with 5.47% gains in the last 24 hours.
Ethereum Price Prediction: Ethereum (ETH) May Break Above the Moving Averages
As the daily chart reveals, the Ethereum price has not been able to display the strong bullish momentum in the past few days. Nevertheless, the good thing is that the coin is likely to begin the movement to the upside. Meanwhile, the Ethereum price needs to stay above $1000 consistently for the next few days to regain the proper bullish momentum as the technical indicator Relative Strength Index (14) recovers from the oversold region.
However, the Ethereum price needs to conquer a few crucial resistance levels of $1300 and $1500 to stay comfortably at the top. Therefore, if the coin closely manages these levels, it could reach the potential resistance levels at $1900, $2000, and $2100. On the downside, if the bears step back into the market, ETH/USD may likely drop below the lower boundary of the channel, any further bearish movement could drag it to the critical supports at $170, $150, and $130.
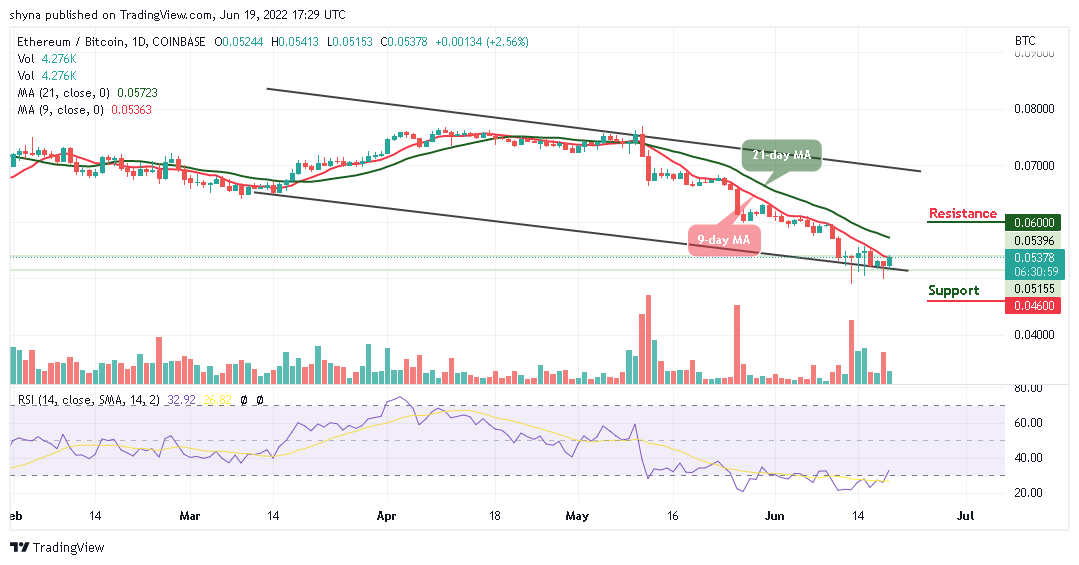
Against Bitcoin, the Ethereum price is rising to cross above the 9-day moving average. Presently, the coin is changing hands at 5378 SAT as the technical indicator Relative Strength Index (14) moves toward the 40-level.

However, the daily chart revealed that buyers are likely to have the day as the resistance level to be reached could be 6000 SAT and above. Conversely, a lower sustainable move below the lower boundary of the channel may cancel the bullish pattern and could attract new sellers to hit the support at 4600 SAT and below.
Join Our Telegram channel to stay up to date on breaking news coverage


