
Join Our Telegram channel to stay up to date on breaking news coverage
The Ethereum price prediction shows that ETH is still struggling to stay above $1000 as the entire market remains at the downside.
Ethereum Prediction Statistics Data:
- Ethereum price now – $1075
- Ethereum market cap – $130.9 billion
- Ethereum circulating supply – 121.2 million
- Ethereum total supply – 121.2 million
- Ethereum Coinmarketcap ranking – #2
ETH/USD Market
Key Levels:
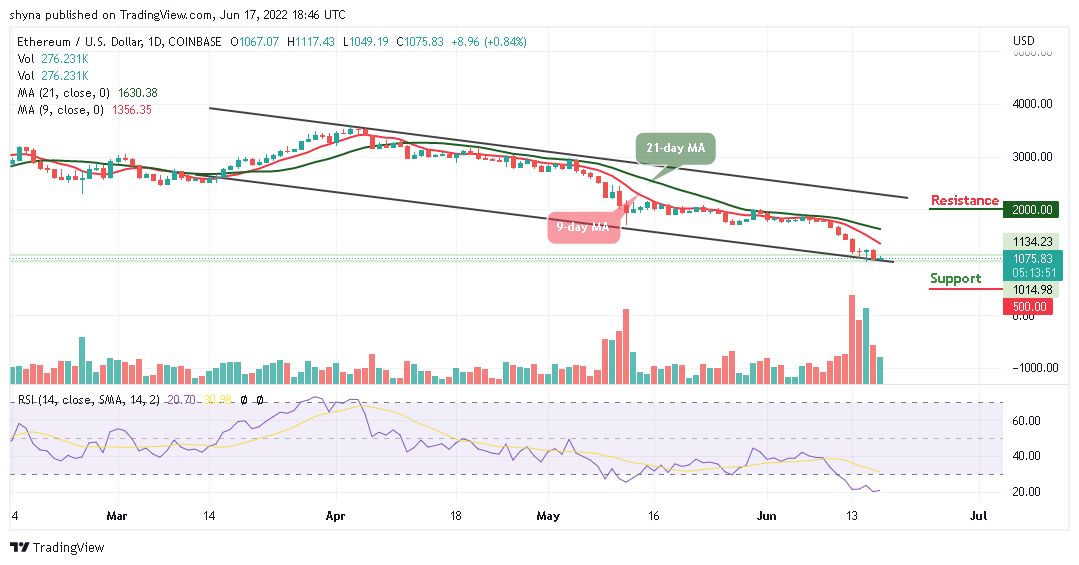
Resistance levels: $2000, $2100, $2200
Support levels: $500, $400, $300
ETH/USD is currently recovering above $1000, and it is likely to climb above $1100 soon. Ethereum has remained relatively down for the past few days as bears are dominating the market. The coin remains at $1075 with the nearest support level located at $950 in the short term.
Ethereum Price Prediction: Ethereum Price May Stay at the Downside
If the Ethereum price break above the 9-day and 21-day moving averages, it could test an important resistance at $1300. However, a successful break above the moving averages could open the doors for a fresh increase above the $1500 level. In the mentioned case, the price is likely to rise towards the $2000, $2100, and $2200 resistance levels in the coming sessions.
Moreover, the technical indicator Relative Strength Index (14) moves within the oversold region. Therefore, if there is a bearish break below the lower boundary of the channel, ETH/USD could test the $900 support. The next major support is near $1000, where the bulls are likely to take a strong stand. Any further losses could lead the price towards the $500, $400, and $300 support levels.
When compared with Bitcoin, the Ethereum price still moving below the 9-day and 21-day moving averages as the market remains at the downside; approaching the lower boundary of the channel. Meanwhile, the technical indicator Relative Strength Index (14) is revealed within the oversold region, a bearish confirmation.
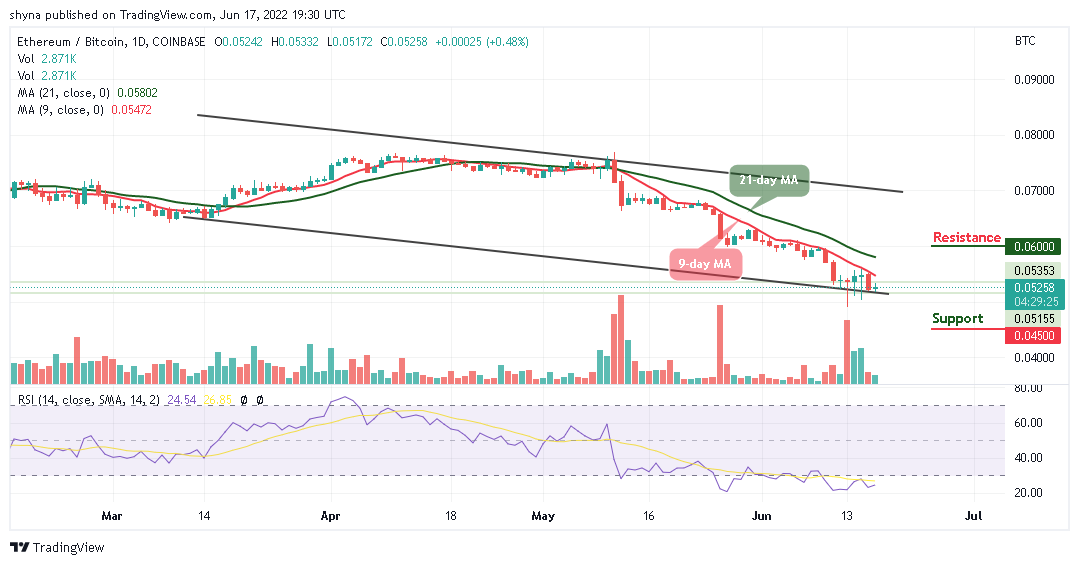
However, if the price breaks above the moving averages, bulls might push the market back to the 0.044 BTC towards the upper channel. Moreover, if the price stays above this barrier, traders may expect an immediate resistance at 0.045 BTC and above. On the other hand, crossing below the channel may locate the support level at 0.030 BTC and below.
Join Our Telegram channel to stay up to date on breaking news coverage