Join Our Telegram channel to stay up to date on breaking news coverage
ETH Pushes Higher – July 28
There has been an obvious sign that the ETH/USD market as the crypto price pushes higher to slightly breaching past the upper range spot at $1,500. In the last seven days of operations, the pairing instruments traded between $1,362.95 and $1,666.88 value lines. Price now features a minimal negative percentage rate of 0.31.
Ethereum (ETH) Statistics:
ETH price now – $1,620.77
ETH market cap – $198.5 billion
ETH circulating supply – 121.7 million
ETH total supply – 121.7 million
Coinmarketcap ranking – #2
ETH Pushes Higher: ETH Market
Key Levels:
Resistance levels: $1,500, $1,750, $2,000
Support levels: $1,000, $800, $600 ETH/USD – Daily Chart
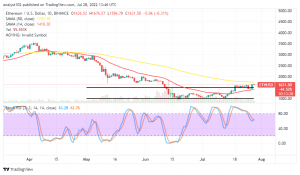
The ETH/USD daily chart reveals the crypto market pushes higher briefly above the $1,500 upper range spot closely beneath the trend line of the bigger SMA. The 14-day SMA indicator is underneath the 50-day SMA indicator. The upper and the lower horizontal lines are at $1,500 and $1,000 to signify the range-bound spots are intact. The Stochastic Oscillators have somewhat slantingly crossed southbound from the overbought region, seemingly trying to cross back northbound at around the 60 range.
Will the ETH/USD market price break above the 50-day SMA point at $1,743.30 soon?
It may take a while before the ETH/USD recovers past the 50-day SMA trend line, which is around a resistance spot of $1,743.30, as the crypto economy pushes higher toward the point in question. If that assumption would have to be, it means long-position takers may have to stay clear of placing a new buying order around the value line for a while. A necessary correction or a pit stop is bound to occur in no time. That is to add more warning notes against new longing positions around that trading capacity.
On the downside of the technical analysis, a bearish candlestick needs to emerge at a higher-resistance trading spot to confirm the possibility of getting a signal suggesting an end to further upsurges through variant resistances. The 50-day SMA indicator will determine the strength of the upside. And if it breaks out aggressively may invalidate the expectation of achieving a decent selling entry around the $1,743.30 resistance level.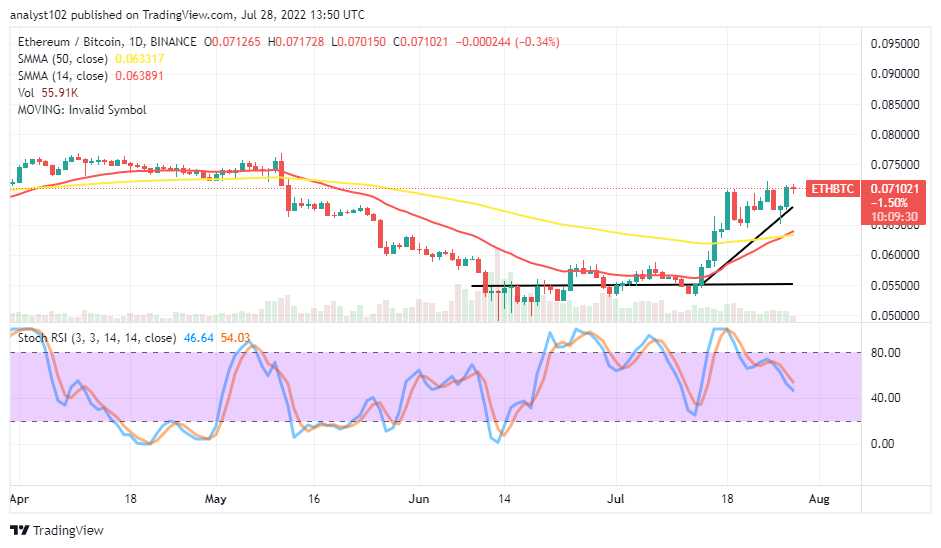
ETH/BTC Price Analysis
Ethereum, compared with the trending capacity of Bitcoin, has been maintaining an increased-trading status against its counter crypto. The cryptocurrency pair price pushes higher above the trend lines of the SMAs. The 14-day SMA indicator has moved northward to join the 50-day SMA indicator. The bullish trend line drew closely below the candlesticks that form the path to the upside. The Stochastic Oscillators have somewhat moved southbound near over the 40 range. The base crypto is encountering a rejection at a higher-trading spot around B0.072092 or thereabout. Price may not push further past it quickly in the near session.
Read more:
Join Our Telegram channel to stay up to date on breaking news coverage