Join Our Telegram channel to stay up to date on breaking news coverage
The Ethereum price prediction reveals that ETH crosses below the 9-day moving average as the market price may gain more downs.
Ethereum Prediction Statistics Data:
- Ethereum price now – $1496
- Ethereum market cap – $182.4 billion
- Ethereum circulating supply – 121.6 million
- Ethereum total supply – 121.6 million
- Ethereum Coinmarketcap ranking – #2
ETH/USD Market
Key Levels:
Resistance levels: $2500, $2700, $2900
Support levels: $800, $600, $400
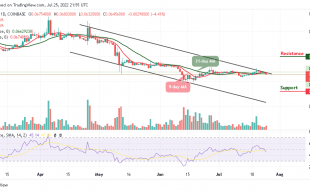
After touching the resistance level of $1610, ETH/USD drops below the 9-day moving average. The coin opens at $1598, and it is currently dropping toward the support level of $1400. For the past few days, the Ethereum price has been moving sideways. The market price could correct higher, but it is likely to face more sellers if it crosses below the 21-day moving average.
Ethereum Price Prediction: What to Expect from Ethereum
At the time of writing, the Ethereum price is breaking to the downside and the coin is likely to break down heavily to gain more downtrends. However, ETH/USD is currently hovering at $1496 as it prepares to cross below the 9-day moving average. Should it spike towards the channel, the critical support levels of $800, $600, and $400 may be tested and the technical indicator Relative Strength Index (14) is moving to cross below the 60-level.
Meanwhile, ETH/USD could either head to the upside or extend its decline towards the support level of $1200. Meanwhile, the price needs to climb above the $2000 level to hit the potential resistance levels at $2500, $2700, and $2900. If not, there is a risk of more downsides below the channel.
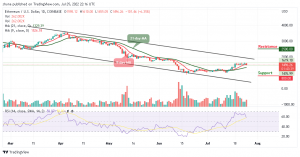
When compared with Bitcoin, the daily chart reveals that the Ethereum price is sliding towards the 9-day and 21-day moving averages. If the price crosses below the 9-day moving average, there is a possibility that the coin may begin the downward trend. The next support key below this barrier is close to the 6500 SAT level. If the price drops more, it could hit the critical support at 6000 SAT and below.
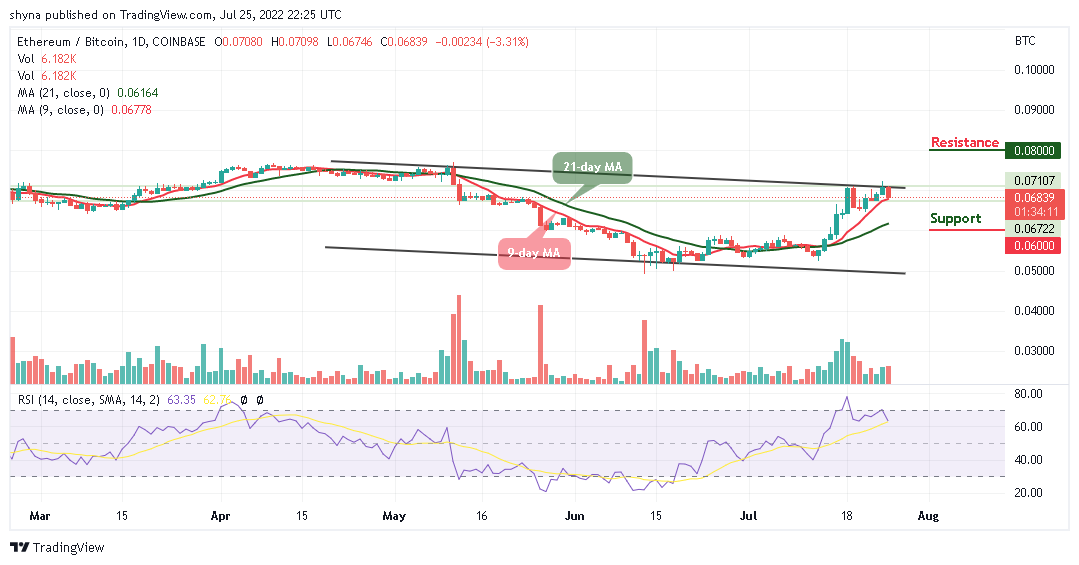
However, if the bulls push the price above the upper boundary of the channel, 7500 SAT resistance may play out. Any further bullish movement could push the coin to the resistance level at 8000 SAT and above. The Relative Strength Index (14) is likely to cross below 60-level if the bears increase the pressure.
Join Our Telegram channel to stay up to date on breaking news coverage