Join Our Telegram channel to stay up to date on breaking news coverage
The Ethereum price prediction reveals that ETH faces key support as the market price follows the downward movement.
Ethereum Prediction Statistics Data:
- Ethereum price now – $1519
- Ethereum market cap – $182.5 billion
- Ethereum circulating supply – 121.6 million
- Ethereum total supply – 121.6 million
- Ethereum Coinmarketcap ranking – #2
ETH/USD Market
Key Levels:
Resistance levels: $2300, $2500, $2700
Support levels: $800, $600, $400
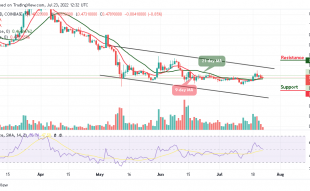
As the market opens today, after touching the resistance level of $1596, ETH/USD drops with a bearish bias. The coin opens at $1535, and it is currently dropping towards the support level of $1500 around the 9-day moving average.
Ethereum Price Prediction: Ethereum Price May Face the South
The Ethereum price is likely to break to the downside, and it is likely to break down heavily to gain more downtrends. However, ETH/USD prepares to cross below the 9-day moving average if the bears are increasing more pressure. Therefore, should it slide below the 21-day moving average, the critical support levels of $800, $600, and $400 may be tested as the technical indicator Relative Strength Index (14) moves to cross below the 60-level.
Meanwhile, ETH/USD could either recover towards the upper boundary of the channel or extend its decline towards the support level of $1500. Meanwhile, the price needs to stay above the moving averages to hit the resistance levels of $2300, $2500, and $2700. If not, there is a risk of more downsides below the channel.
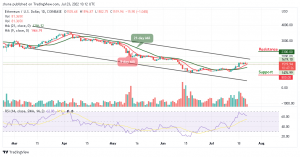
When compared with Bitcoin, the daily chart reveals that the Ethereum price is hovering above the 9-day and 21-day moving averages. If the price begins a bullish movement, there is a possibility that the coin may cross above the upper boundary of the channel. The next resistance key may be located at the 7500 SAT level. If the price rises, it could even break the 8000 SAT and above.
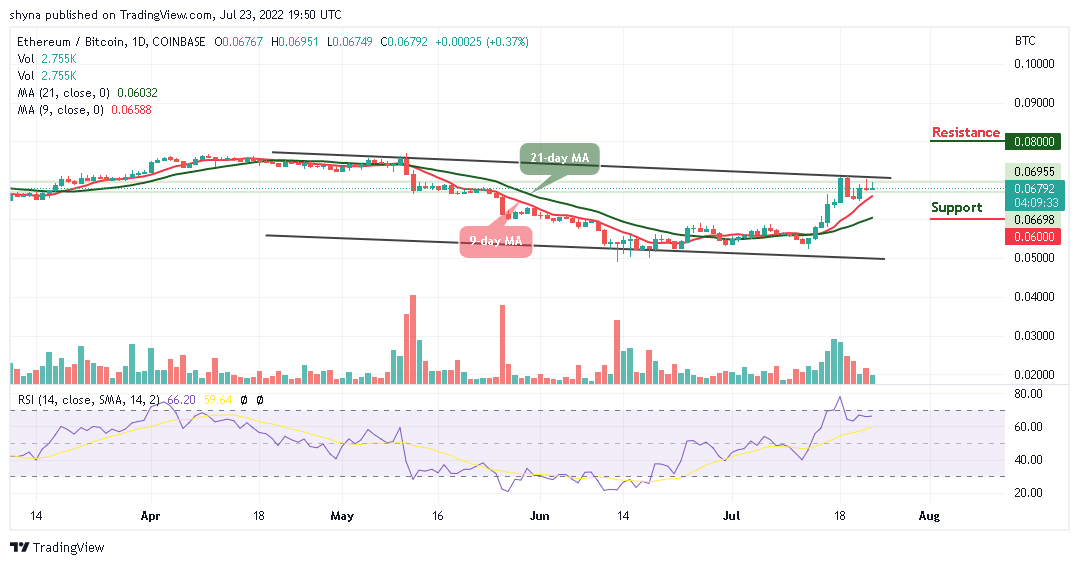
However, if the price slide below the 21-day moving average, the bearish movement could roll the coin to the critical support at 6000 SAT and below. The Relative Strength Index (14) still remains below 70-level, suggesting sideways movement.
Join Our Telegram channel to stay up to date on breaking news coverage