Join Our Telegram channel to stay up to date on breaking news coverage
The Ethereum price prediction shows that ETH sits at a crucial support level that could determine where the coin will be heading to.
Ethereum Prediction Statistics Data:
- Ethereum price now – $1508
- Ethereum market cap – $183.2 billion
- Ethereum circulating supply – 121.6 million
- Ethereum total supply – 121.6 million
- Ethereum Coinmarketcap ranking – #2
ETH/USD Market
Key Levels:
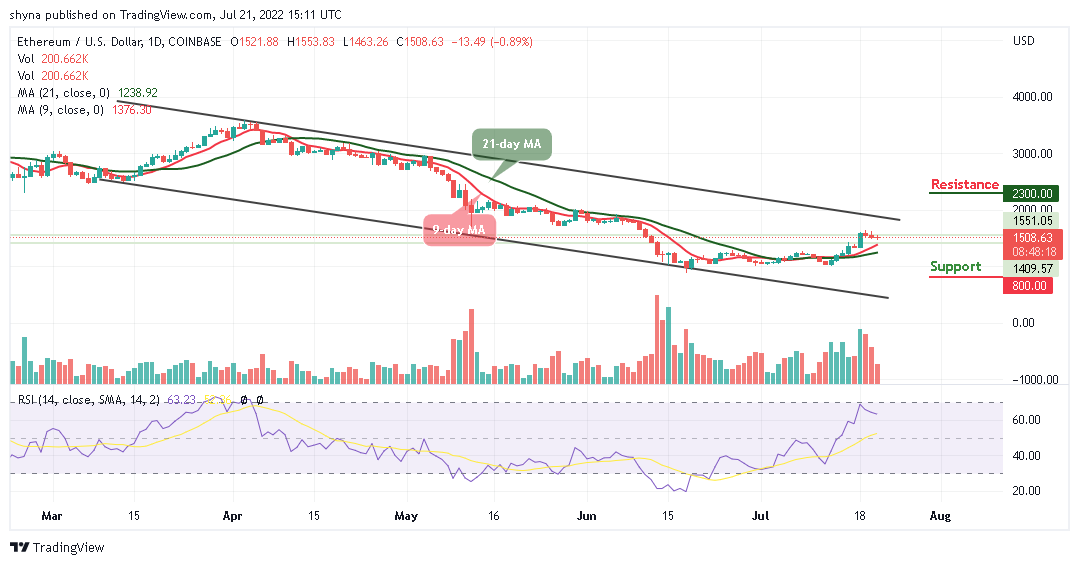
Resistance levels: $2300, $2500, $2700
Support levels: $800, $600, $400
At the time of writing, ETH/USD is likely to follow the negative side as the bears step back into the market heavily. The Ethereum price failed to create a new high above the resistance level of $1553 and if there is short-term selling pressure, Ethereum could most likely tackle it and make a comeback at the level mentioned above.
Ethereum Price Prediction: Can Ethereum (ETH) Move to the South?
According to the daily chart, the Ethereum price experiences a slight drop below the daily high of $1553. However, any increasing selling pressure could bring the price to touch a new low at $1500. On the other hand, if the buyers manage to maintain the bullish momentum, a slight upward movement could keep the Ethereum price above the channel for the coin to hit the resistance levels of $2300, $2500, and $2700 respectively.
Therefore, any failure to stay above the moving averages could spell trouble for the coin. Looking at it from below, the downswing may trigger a sell-off below the 21-day moving average if the Relative Strength Index (14) moves to cross below the 60-level, it is likely for the Ethereum price to locate the supports at $800, $600, and $400.
Against Bitcoin, the last few hours may reveal a bullish movement on the long channel, and this reveals that the coin may cross above the upper boundary of the channel if the bulls put more effort. The Relative Strength Index (14) is now seen moving above 60-level, suggesting more bullish signals.
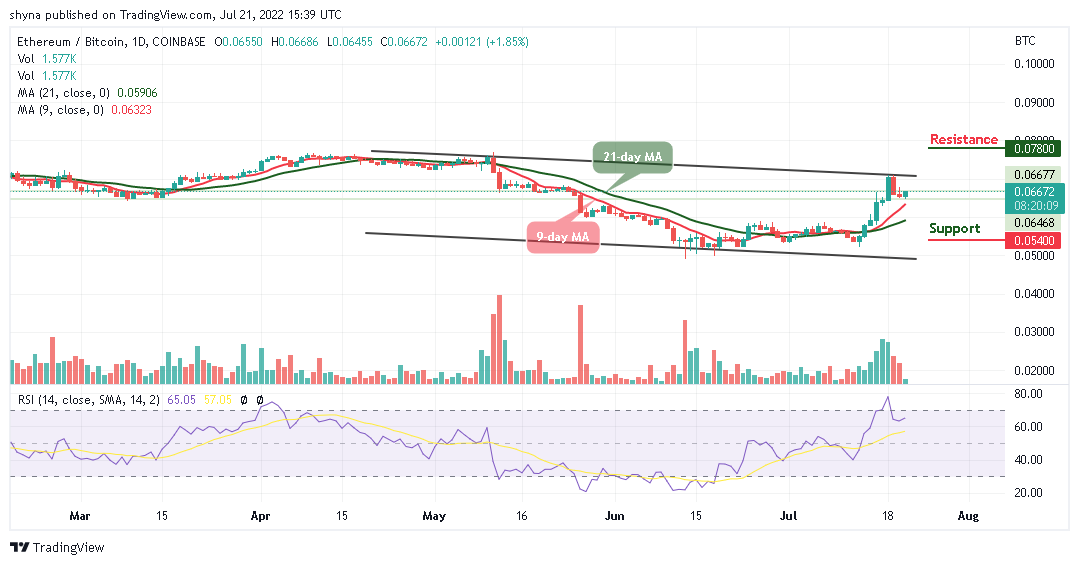
When observing the technical indicator, the Relative Strength Index (14) is heading to the upside, crossing above the channel can make the coin hit the resistance level of 7800 SAT and above but should in case the bulls fail to push ETH/BTC upward, sellers can use the opportunity to bring it to the support level of 5400 SAT and below.
Join Our Telegram channel to stay up to date on breaking news coverage