Join Our Telegram channel to stay up to date on breaking news coverage
The Ethereum price prediction reveals that ETH is currently trading close to $2000 after a significant dip below $1950.
Ethereum Prediction Statistics Data:
- Ethereum price now – $1991
- Ethereum market cap – $242.6 billion
- Ethereum circulating supply – 121.9 million
- Ethereum total supply – 121.9 million
- Ethereum Coinmarketcap ranking – #2
ETH/USD Market
Key Levels:
Resistance levels: $3000, $3200, $3400
Support levels: $1000, $800, $600
Your capital is at risk.
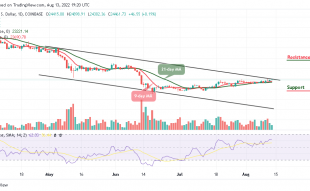
ETH/USD is trading at $1991 where the coin is likely to cross above the upper boundary of the channel. The technical indicator Relative Strength Index (14) shows that the bullish movement may be coming close as the signal line is crossing into the overbought region. However, the 9-day and 21-day moving averages indicate that bulls are likely to control the market as the 9-day MA remains above the 21-day MA.
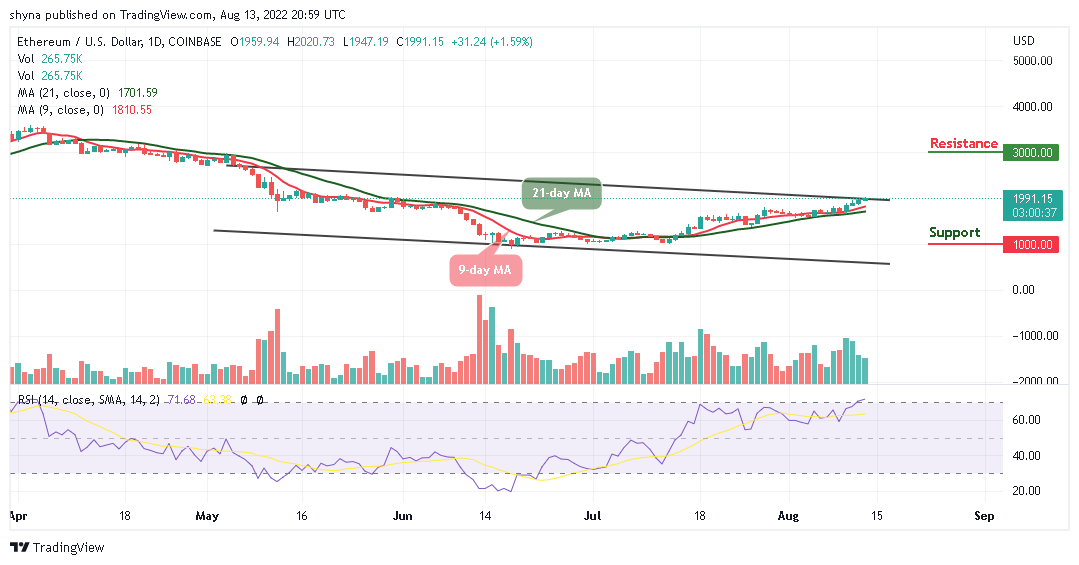
Ethereum Price Prediction: What to Expect from Ethereum
As the Ethereum price is hovering above the 9-day and 21-day moving averages within the channel, the coin is likely to embark on a movement towards the upside. However, a sustainable move from this barrier may improve the bullish movement and allow for an extended recovery towards the resistance level of $2100. However, if the coin stays above this level, it could spike and hit the potential resistance levels at $3000, $3200, and $3400.
Moreover, the technical indicator Relative Strength Index (14) moves into the overbought region, but any bearish movement out of this barrier could worsen the technical picture and lay the ground for further sell-off below the 9-day and 21-day moving averages. Any further bearish movement could locate the supports at $1000, $800, and $600 respectively.
Against Bitcoin, the Ethereum price is moving to cross above the upper boundary of the channel as the coin spike to the upside. On the other hand, if the market drops below the 9-day and 21-day moving averages, the critical support may come at 0.070 BTC and below.
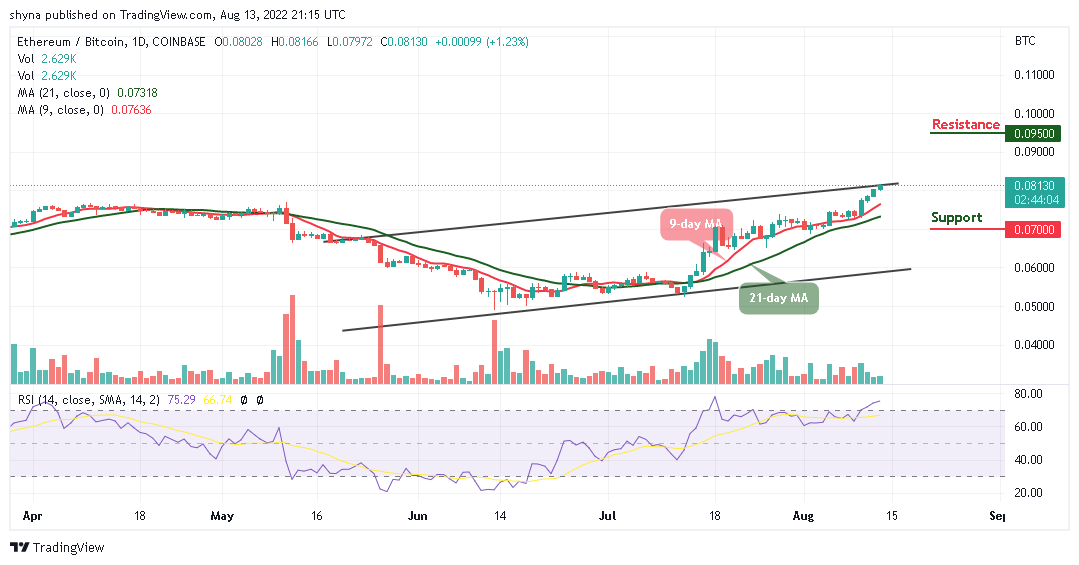
On the upside, if the coin crosses above the channel, the resistance level of 9500 SAT and above may be visited. Meanwhile, the technical indicator Relative Strength Index (14) is already within the overbought region, suggesting that the market may go further upside.
Related
Join Our Telegram channel to stay up to date on breaking news coverage