Join Our Telegram channel to stay up to date on breaking news coverage
Ethereum Price Prediction – March 1
The Ethereum price prediction shows that ETH is seen trading near the $3000 price mark, and it is currently changing hands at $2955.
ETH/USD Market
Key Levels:
Resistance levels: $3500, $3700, $3900
Support levels: $2500, $2300, $2100
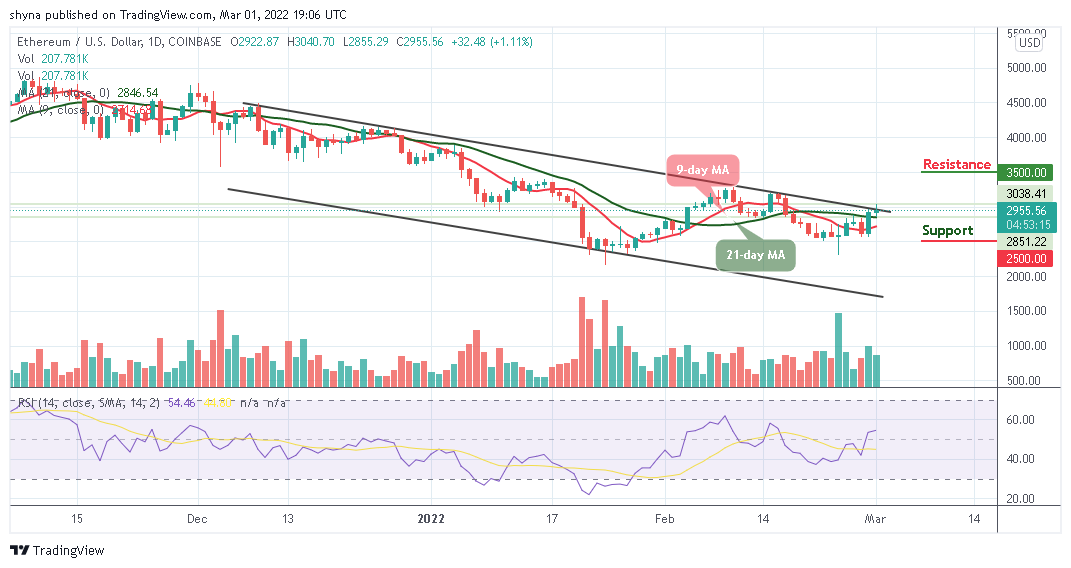
ETH/USD has once again hit the $3000 mark as the number two crypto crosses above the upper boundary of the channel as it is been confirmed by the technical indicator. However, the Ethereum price is hovering above the 9-day and 21-day moving averages with 1.11% gains in the last 24 hours. Meanwhile, ETH/USD may again drop below the moving averages if the bulls fail to push the price above the channel.
Ethereum Price Prediction: Ethereum (ETH) May Gain More Uptrend
According to the daily chart, the Ethereum price has not been able to display a strong bullish movement since the month begins. Therefore, the Ethereum price needs to stay above $3000 consistently for the next few days to regain the proper bullish momentum as the technical indicator Relative Strength Index (14) may cross above 60-level.
However, at the time of writing, the Ethereum price only needs to conquer a few crucial resistance levels of $3200 and $3400 to recover the recent losses. Now, if the coin closely manages these levels well, then it could reach the potential resistance levels at $3500, $3700, and $3900 respectively. On the downside, if the bears bring the coin to the downside, ETH/USD may likely drop and move towards the lower boundary of the channel, any further bearish movement could drag it to the critical supports at $2500, $2300, and $2100 respectively.
Against Bitcoin, Ethereum is currently trading below the 9-day and the 21-day moving averages, facing the lower boundary of the channel. The Ethereum price is changing hands at 6729 SAT as the technical indicator Relative Strength Index (14) moves to cross below 40-level.
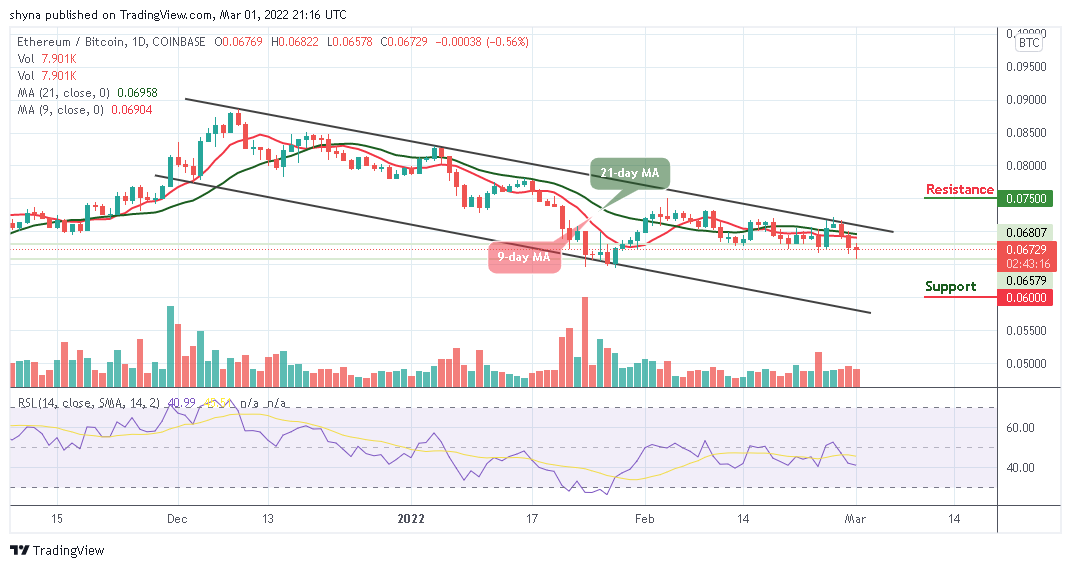
However, the daily chart reveals that sellers are having the day as the coin touches the daily low of 6578 SAT. Further bearish movement could hit the support level of 6000 SAT and below. Conversely, a higher sustainable move above the 9-day and 21-day moving averages may likely cancel the bearish pattern and could attract new buyers to hit the resistance at 7500 SAT and above.
Looking to buy or trade Ethereum (ETH) now? Invest at eToro!
68% of retail investor accounts lose money when trading CFDs with this provider
Join Our Telegram channel to stay up to date on breaking news coverage