Join Our Telegram channel to stay up to date on breaking news coverage
ETH Price Prediction – March 13
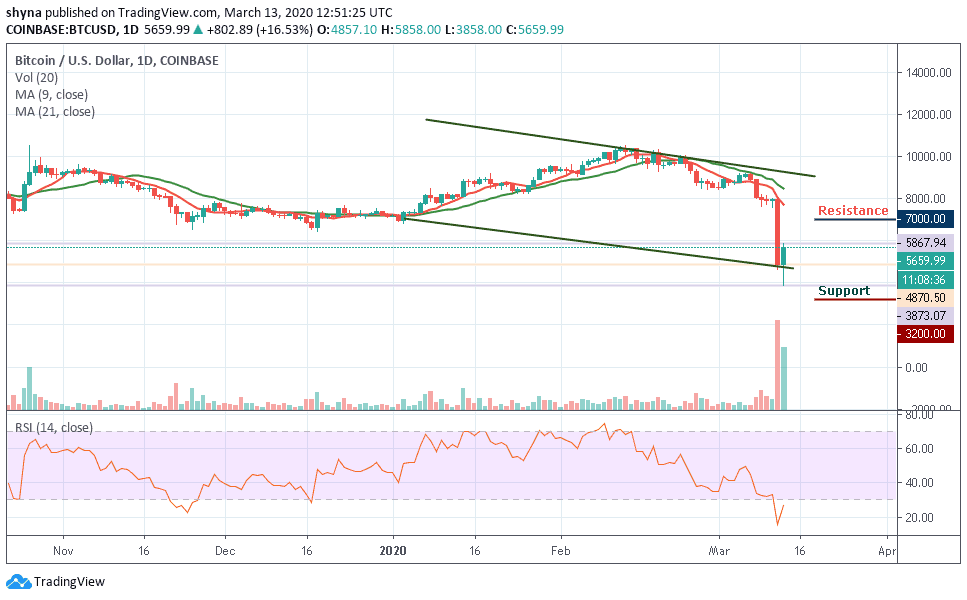
ETH/USD is recovering from the slump; strong resistance is created by the intraday high of $150.
ETH/USD Market
Key Levels:
Resistance levels: $196, $206, $216
Support levels: $47, $37, $27
At the time of writing, ETH/USD is changing hands at $118. The second digital coin with the current market value dropped below $100 for the first time since more than a year ago but managed to regain the ground amid technical correction. The coin has gained over 7.84% since the beginning of the day, though it is still down over 20% on a day-to-day basis.
On the other hand, the technical indicator RSI (14) shows that the bulls are making a noticeable effort considering that the price dived to $89.06 during the Asian hours. Meanwhile, the oversold conditions suggest that bearish exhaustion has kicked in. More so, the recovery above 30 followed by a continued movement towards the average (50) would stir up more bullish action.
However, if the bears try to bring down the price below the descending channel, they can expect immediate support to be located at $80 which is below the trend line. Below $60, further support is found at $47, $37 and $27. But if the buyers continue to push the market higher, the immediate resistance above $170 level will be located. Above this, further resistance levels lie at $196, $206 and $216.
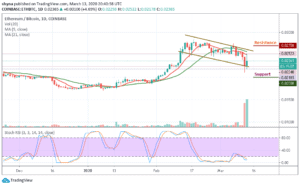
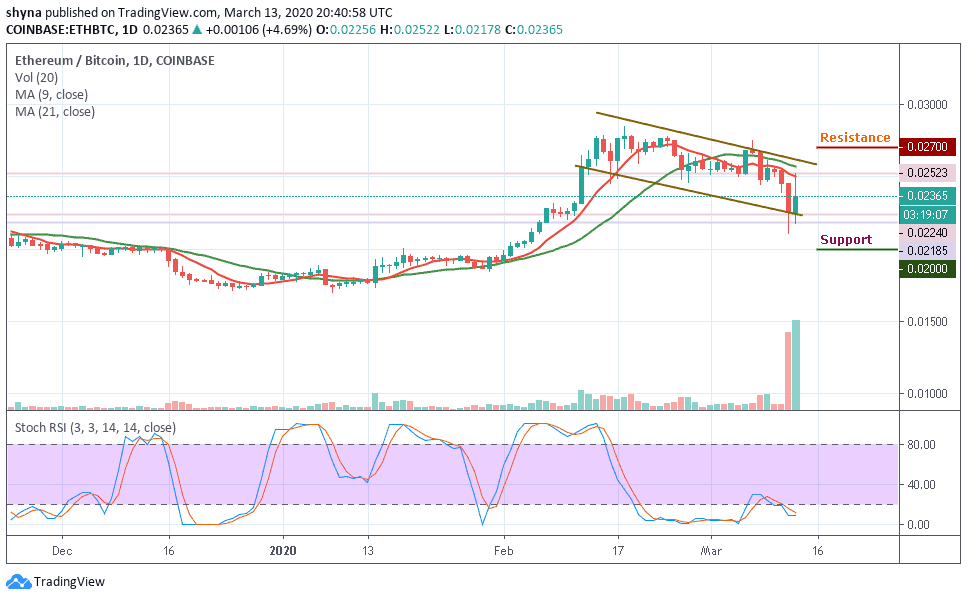
Comparing with BTC, the Ethereum price keeps following the downward trend within the channel as the bears are still dominating the market. ETH/BTC is currently trading at 0.0236 BTC as the bulls are trying to push the price to the north. Looking at the chart, if the price continues to rise, the next key resistance may be at 0.0270 BTC and above.

In other words, if the bears continue with the downward trend, 0.0200 BTC and beyond may play out before rolling to 1700 SAT and this may create a new monthly low for the pair. The stochastic RSI is moving within the oversold zone, which shows more bearish signals.
Please note: Insidebitcoins.com is not a financial advisor. Do your research before investing your funds in any financial asset or presented product or event. We are not responsible for your investing results.
Join Our Telegram channel to stay up to date on breaking news coverage