Join Our Telegram channel to stay up to date on breaking news coverage
Bitcoin (BTC) Price Prediction – March 13
For Bitcoin to start moving higher, its price must defend the $5,000 support as if its future performance depends on it.
BTC/USD Long-term Trend: Bearish (Daily Chart)
Key levels:
Resistance Levels: $7,000, $7,200, $7,400
Support Levels: $3,200, $3,000, $2,800
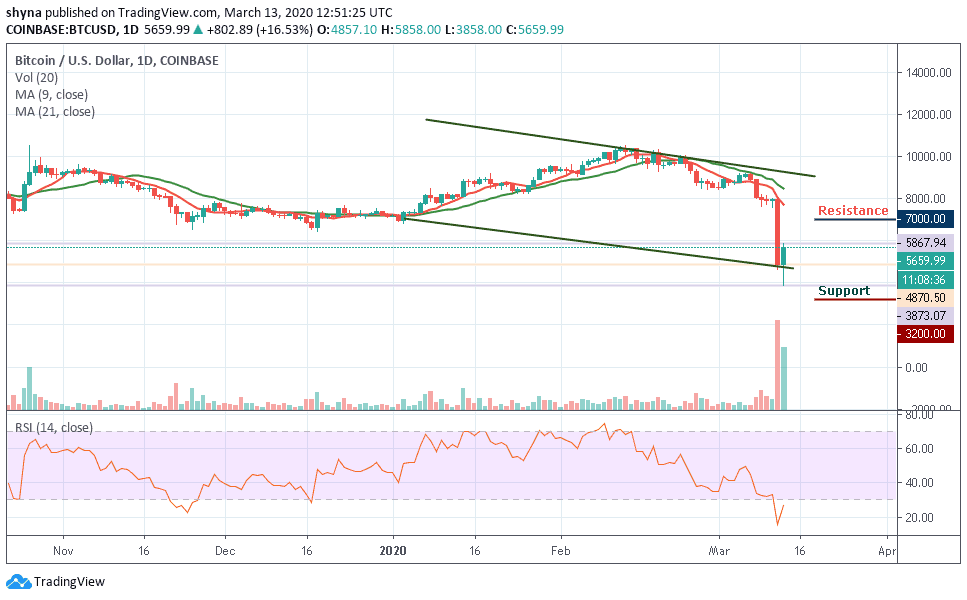
Calm returns to the cryptocurrency market after a night of despair. The freefalling yesterday was unrelenting, leaving the traders out of breath and bulls paralyzed. The biggest blow was the drop under $4,000 and for the first time in more than a year, BTC/USD showed signs of testing $3,000 support. Meanwhile, it is essential to note that, the downtrend in 2018 found a balance of $3,150 and Bitcoin price must defend the $5,000 support as if its future performance depends on it.
Impressively, the bulls didn’t hibernate as long as they pulled the price of Bitcoin from the beneath and hit an intraday high of $5,867. The BTC/USD however adjusted to $5,659 and posted a 16.53% gain compared to $ 4,870 which happens to be the opening value. More so, the current trend has a short-term upside bias, but declining volatility could slow down the recovery. In other words, stability is likely to be much appreciated following the fluctuations recorded over the past 24 hours.
Furthermore, the support level of $5,000 is key to the recovery that targets levels above $6,500. A break above this level on the daily chart could boost BTC/USD to higher levels. Meanwhile, the downward RSI (14) suggests that selling activities are not entirely ousted and their effects will continue to be felt in the market. The resistance levels to watch are $7,000, $7,200 and $7,400 while that of support levels are $3,200, $3,000 and $2,800 respectively.
BTC/USD Medium – Term Trend: Bearish (4H Chart)
Looking at the 4-hour chart, the bears have been dominating the market for the past few weeks, but the bulls are now stepping back into the market, trying to defend the $5,000 support. If not, the $4,500 and below may come into play if BTC breaks below the lower boundary of the channel.
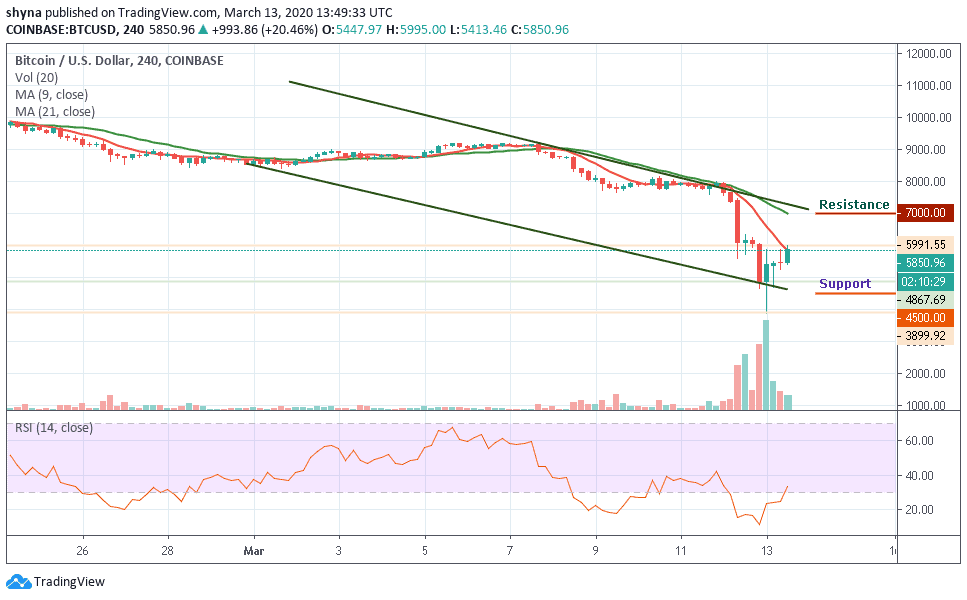
However, in as much as the buyers put more effort to power the market, traders can expect a retest at $6,500 resistance level and breaking this level may further push the price towards the resistance level of $7,000 and above as the RSI (14) is recovering from the oversold zone, now suggesting bullish movement.
Please note: Insidebitcoins.com is not a financial advisor. Do your research before investing your funds in any financial asset or presented product or event. We are not responsible for your investing results.
Join Our Telegram channel to stay up to date on breaking news coverage