Join Our Telegram channel to stay up to date on breaking news coverage
ETH Price Prediction – December 9
Yesterday, the cryptocurrency increased $150.70 before the recent price fall but today, the Ethereum price (buy Ethereum with PayPal here) saw a deep decline of around -2.34%.
ETH/USD Market
Key Levels:
Resistance levels: $162, $166, $170
Support levels: $138, $134, $130
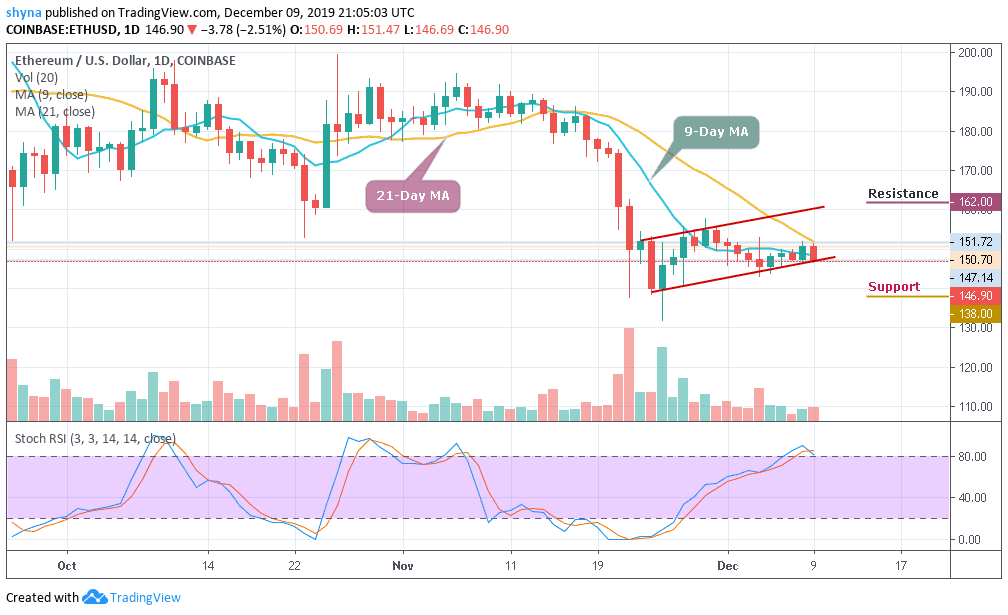
Ethereum (ETH) price has been consolidating within the ascending channel for the past few days. For now, ETH/USD is currently trading at $146.90 below the 9-day and 21-day MA at the time of writing. At the opening of the market today, the daily chart shows that the price first went up to $151.72, where it met resistance and then fall to $147.15 support level.
However, in the early hours of today, people that buy Ethereum have retained control of the market. Yesterday’s trading has been a resounding victory for the bulls as Ethereum’s price jumped up, breaking above the 9-day moving average in the process. The daily breakdown shows us that ETH/USD was following an uptrend before it dropped to $150.70 where it closed.
In other words, for a backward movement, the market can be supported at $138 and $134 levels, if the price falls below the previous levels; another support is around $130. But should in case the price exceeds the indicated level by breaking above the channel, the resistance levels of $162, $166 and $170 may be visited. The stochastic RSI is facing the overbought zone, which may likely give more support to the bulls.
Against Bitcoin, Ethereum (ETH) is currently changing hands at the 2006 SAT after witnessing some heavy bearish moment in the last few days. Looking at the daily chart, the current trend of the coin is perpetually looking bullish in the short-term, moving towards the 9-day and 21-day moving within the descending channel.
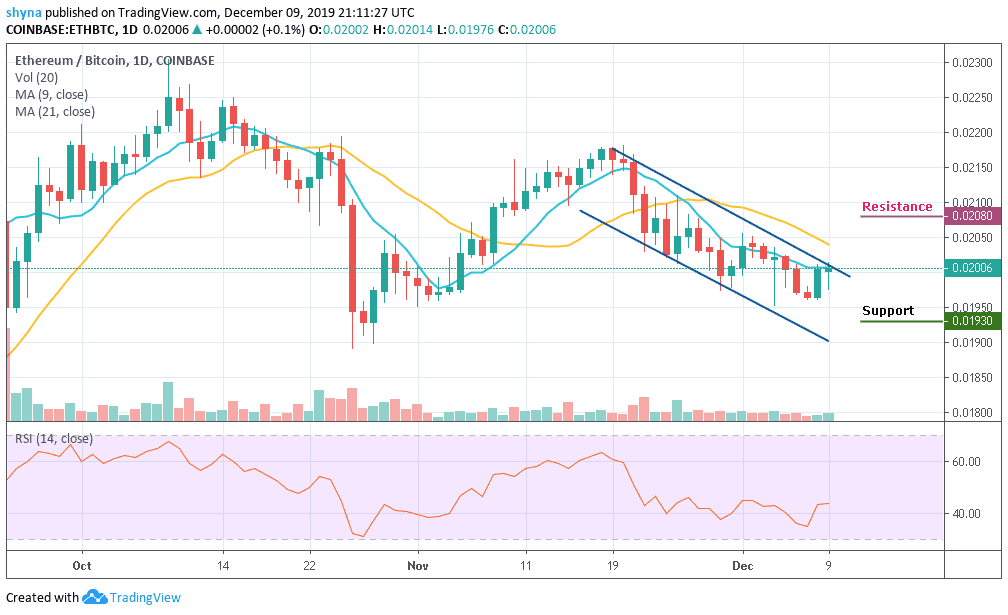
Meanwhile, the resistance levels to look for are 2080 SAT and 2150 SAT while the closest support levels to keep an eye on are 1930 SAT and potentially 1900 SAT. The RSI (14) moves above level 40, which may likely give more bullish signals in the nearest term.
Please note: Insidebitcoins.com is not a financial advisor. Do your research before investing your funds in any financial asset or presented product or event. We are not responsible for your investing results.
Join Our Telegram channel to stay up to date on breaking news coverage