Join Our Telegram channel to stay up to date on breaking news coverage
The Ethereum price faces downward, but the second largest crypto may continue to move down towards $900 if it drops near the channel.
Ethereum Prediction Statistics Data:
- Ethereum price now – $1292
- Ethereum market cap – $158.7 billion
- Ethereum circulating supply – 122.6 million
- Ethereum total supply – 122.5 million
- Ethereum Coinmarketcap ranking – #2
ETH/USD Market
Key Levels:
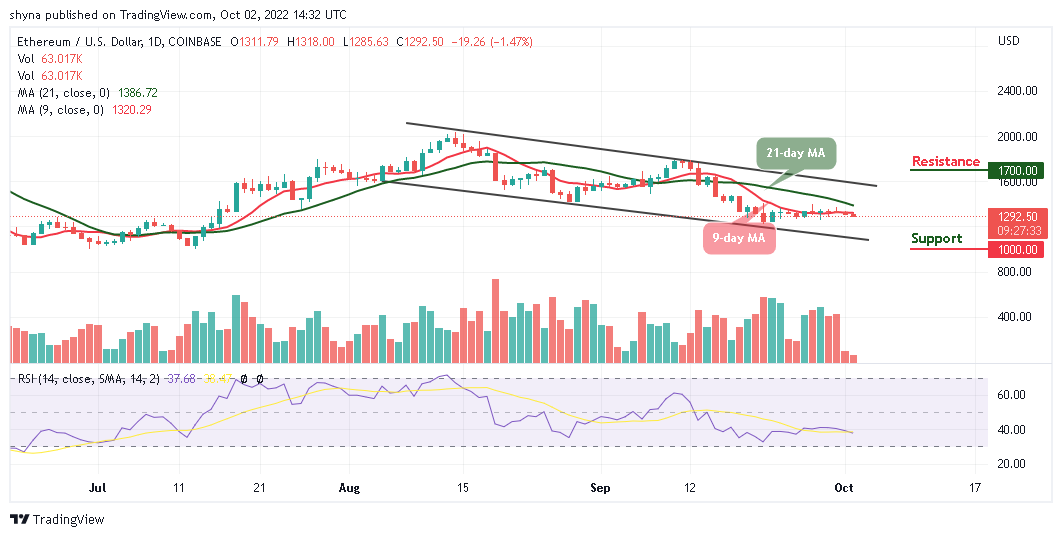
Resistance levels: $1700, $1900, $2100
Support levels: $1000, $800, $600
Your capital is at risk
ETH/USD has been dropping with a bearish bias at the European session today. The coin opens at $1311 and it is currently dropping below the $1300 level to touch the daily low of $1285. However, the Ethereum price did start a nasty decline and broke many supports below the 9-day moving average.
Ethereum Price Prediction: Would Ethereum Go Up or Down?
As the Ethereum price moves below the 9-day moving average, there is a close support level at $1250 which could hold the bearish movement. With the look of things, heading towards the lower boundary of the channel could open the doors for more losses and the price may tumble below the $1200 level, should it spike below the lower boundary of the channel, the critical support levels of $1000, $800, and $600 may be tested as the technical indicator Relative Strength Index (14) moves below 40-level.
However, if the bulls push the price above the 21-day moving average, ETH/USD could either recover above $1318 or extend its decline. On the upside, the bulls need to push the price above the $1300 resistance before reaching the potential resistance levels of $1700, $1900, and $2100. If not, there is a risk of more downsides below the lower boundary of the channel.
When compares with Bitcoin, the daily chart shows that the Ethereum price is ranging within the channel. Meanwhile, if the price crosses above the 9-day and 21-day moving averages, there is a possibility that additional benefits could be obtained in the long term. Therefore, if the price begins to rise; it could even break the 7800 SAT and above in future sessions.
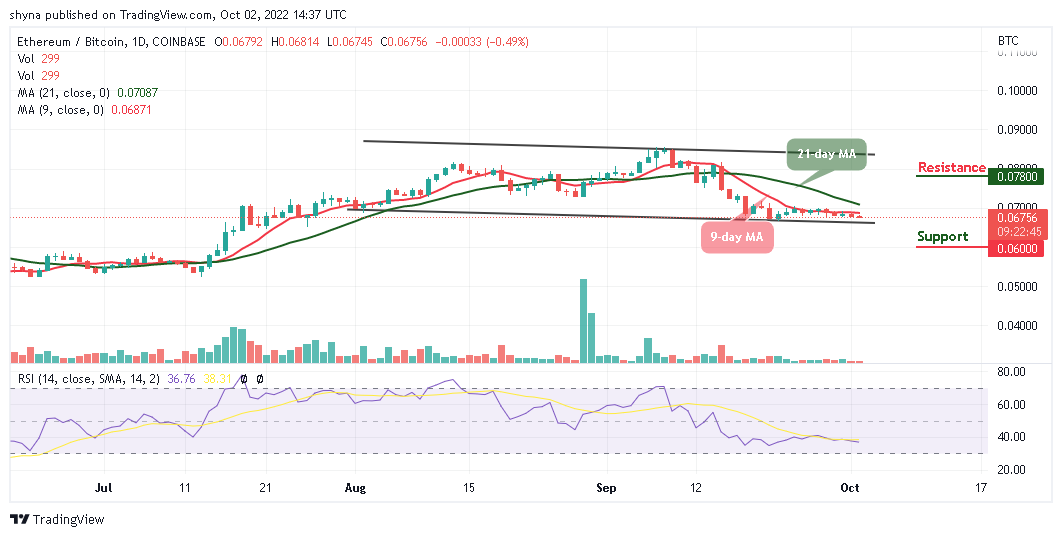
Moreover, if the bears increase within the market, the 6500 may play out before rolling to critical supports at 6000 SAT and below as this may create a new monthly low for the coin. However, the daily outlook is a sideways movement while the Relative Strength Index (14) is moving in the same direction below the 40-level to keep the bearish movement.
Join Our Telegram channel to stay up to date on breaking news coverage