Join Our Telegram channel to stay up to date on breaking news coverage
The Ethereum (ETH) price prediction is getting ready to trade above the 9-day moving average as the market ranges.
Ethereum Prediction Statistics Data:
- Ethereum price now – $1331
- Ethereum market cap – $163.5 billion
- Ethereum circulating supply – 122.5 million
- Ethereum total supply – 122.5 million
- Ethereum Coinmarketcap ranking – #2
ETH/USD Market
Key Levels:
Resistance levels: $1800, $2000, $2200
Support levels: $900, $700, $500
Your capital is at risk
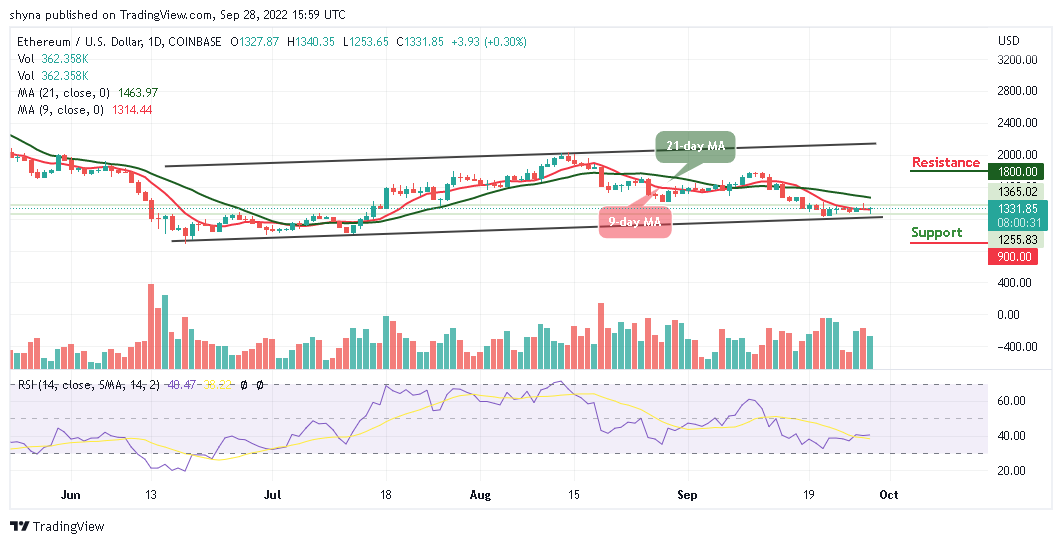
ETH/USD is currently ranging around $1331.85, and it is likely to climb above the 9-day moving average. Now, the Ethereum price has been moving sideways, and the coin is now struggling to cross above the 21-day moving average. The Ethereum price is likely to remain at the downside as the red-line of the 9-day moving average stays below the green-line of the 21-day moving average.
Ethereum Price Prediction: Ethereum (ETH) May Keep Moving Sideways
According to the daily chart, if the Ethereum price break and remain above the 9-day and 21-day moving averages; it could hit the nearest resistance level of $1400. However, a successful break above this level could open the doors for an additional increase to the $1600 level. In the meantime, any further bullish movement could push the coin to the potential resistance levels of $1800, $2000, and $2200.
Moreover, as the technical indicator Relative Strength Index (14) moves above 40-level, the nearest support could be found at the $700 level. If there is a bearish break below this support, ETH/USD could test another support before breaking the lower boundary of the channel. However, any further losses could lead the price towards the support levels of $900, $700, and $500.
Against Bitcoin, the Ethereum price is moving bearishly, and the coin hovers around 6809 SAT. Therefore, if the price crosses below the lower boundary of the channel, there is a possibility that additional supports may be created in the long term. However, the next support level below the current price is close to the 6500 SAT. More so, if the price keeps falling, it could hit the critical support at 5400 SAT and below.
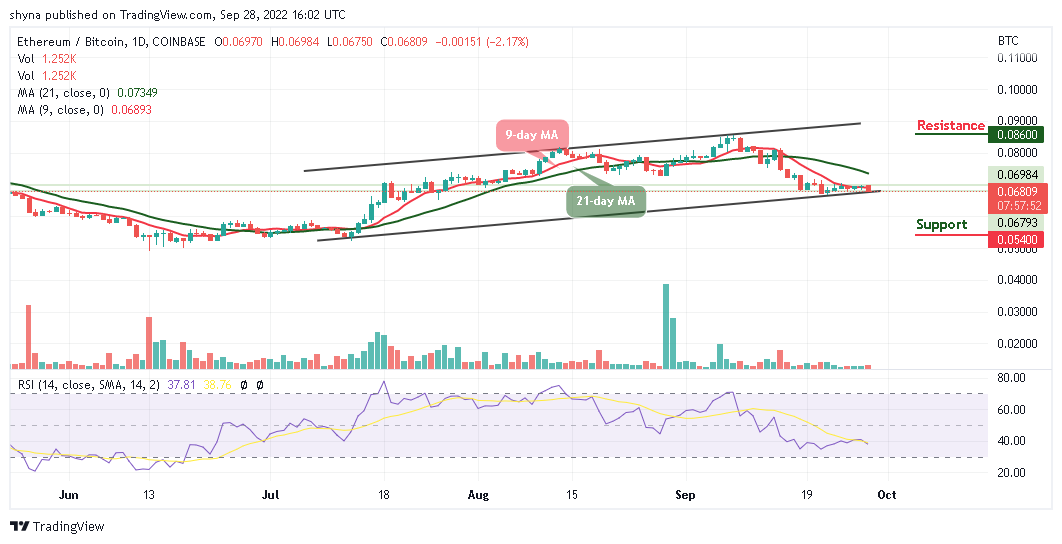
On the contrary, if the bulls resume back, a bullish movement above the 21-day moving average may play out and the potential resistance level could be located at 8600 and above while the technical indicator Relative Strength index (14) moves to cross below the 40-level, which suggests a downward movement.
Join Our Telegram channel to stay up to date on breaking news coverage