Join Our Telegram channel to stay up to date on breaking news coverage
ETH Price Prediction – June 20
The price to buy Ethereum seems to be showing more bearish signs throughout the long-term consolidation phase seen in recent days.
ETH/USD Market
Key Levels:
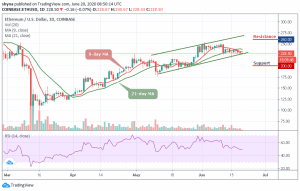
Resistance levels: $260, $265, $270
Support levels: $200, $195 $190

The bulls seem to be sitting on the side-lines at the moment as ETH/USD is currently experiencing a price drop. Traders were expecting a lot from the coin, although the last two months reflected an improvement in ETH prices. The cryptocurrencies market shows that the majority of the top-ten altcoins started with a drop today. The Ethereum price is currently moving under the 9-day and 21-day moving averages, exchanging hands at $228.50 which is yet to break below the lower boundary of the channel.
Nevertheless, a bearish drop may continue to roll the market down to $200, $195, and $190 support levels while possible bullish surge may drive the market above the moving averages, looking for a potential resistance level of $250. Above the level, $260, $265 and $270 may further provide other resistance levels for the market.
Meanwhile, the technical indicator RSI (14) is focusing on the negative side, and staying there may cause the coin to remain below the $230 level.
Looking at it against BTC, ETH has continued to trade sideways below the moving averages of 9-day and 21-day around 0.0246 BTC. The coin is secured from above by resistance at 0.0255 BTC and has not been able to rise above 0.0260 BTC since the beginning of this month.
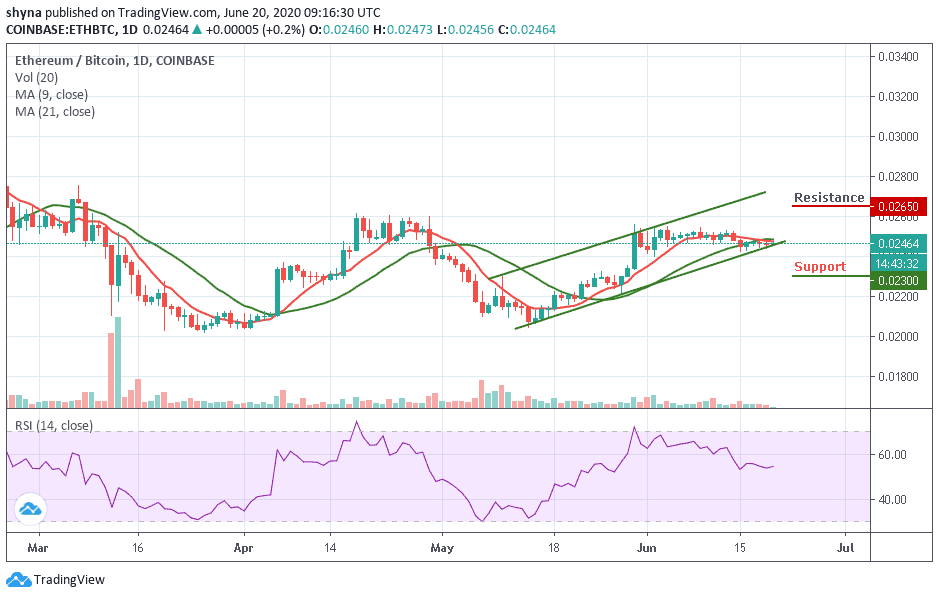
However, the trading volume of ETH/BTC has dropped significantly and the RSI (14) remains in the sideways movement below 60-level which shows that the market is indecisive at the moment. If the price wants to break above the moving averages, it would need to see the RSI (14) rise higher above the 60-level. The resistance levels to watch for are 0.0265 BTC and above while the support levels are 0.0230 BTC and below.
Join Our Telegram channel to stay up to date on breaking news coverage