


Join Our Telegram channel to stay up to date on breaking news coverage
Bitcoin (BTC) Price Prediction – June 20, 2020
After failing to clear the resistances at $9,500 and $9,680, BTC/USD pair has gradually dropped to $9,323.70 low. Since May Bitcoin has been consolidating between $9,000 and $10,000. Which direction is Bitcoin heading?
Key Levels:
Resistance Levels: $10,000, $11, 000, $12,000
Support Levels: $7,000, $6,000, $5,000
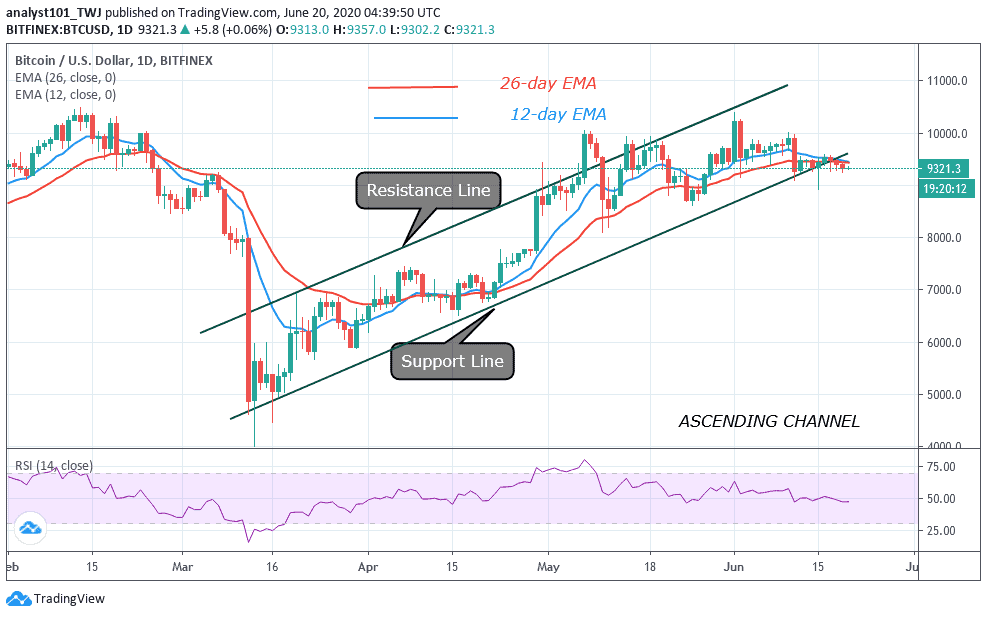
Yesterday, Bitcoin dropped to $9,237 low and immediately corrected upward to $9,323.70, at the time of writing. This has been the market scenario for the past couple of weeks. Market analysts believe that as long as price continues to hold between $9,050- $9,300, the upside range will continue to retest the $10,000 overhead resistance. They have predicted a bullish scenario if Bitcoin continues to trade sideways in the $9,000 region. According to reports in 2019, Bitcoin sustains a price level of $9,250 – $9,300 and this level influenced Bitcoin to reach $14,000 high. Nonetheless, Bitcoin is consolidating above $9,300.
This indicates that the sideways trading will continue until a breakout occurs. In the upside range trading, BTC will fluctuate between $9,300 and $9,800. The $10,000 overhead resistance will be retested once the resistances at $9,800 and $9,880 are cleared. A breakout above the overhead resistance has a target objective of $10,500 and $11,000. The Relative Strength Index period 14 is at level 47. It indicates that BTC is in the downtrend zone and below the centerline 50. Meanwhile, BTC is trading in the upside range above $9,300.
BTC/USD Medium-term Trend: Bullish (4-Hour Chart)
On the 4 hour chart, the King coin has been on a downward move. On June 1, price rebounded and reached a high of $10,400. The following day, BTC has a bearish reaction as the market dropped to $9,150.
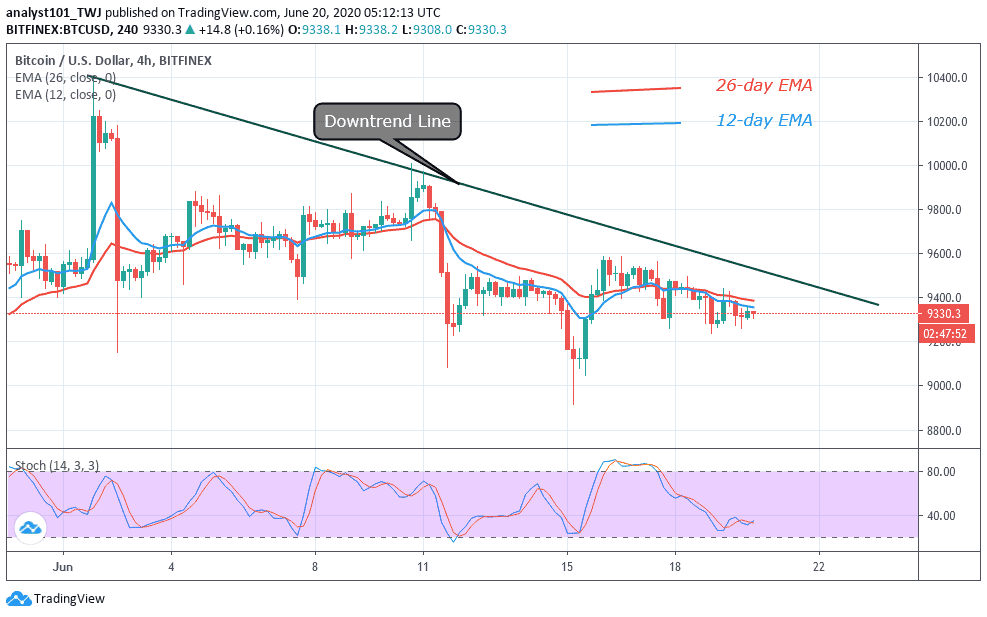
Buyers were unrelenting as price attempted to break the downtrend line on June 10. Sellers defended the recent high as BTC plunged to $9,084 low. Also, the coin fell to the low of $8,914 but the market corrected upward. Although Bitcoin has recovered above $9,300, the bulls are yet to break the downtrend line. On the upside, if the price breaks and closes above the downtrend line, the uptrend will resume. The king coin is above 25% range of the daily stochastic. Presently, it is in a bullish momentum.
Join Our Telegram channel to stay up to date on breaking news coverage
