Join Our Telegram channel to stay up to date on breaking news coverage
Ethereum Price Prediction – January 25
In the early hours of today, the Ethereum price prediction shows that ETH touches the support level of $2351.
ETH/USD Market
Key Levels:
Resistance levels: $2900, $3100, $3300
Support levels: $2000, $1800, $1600
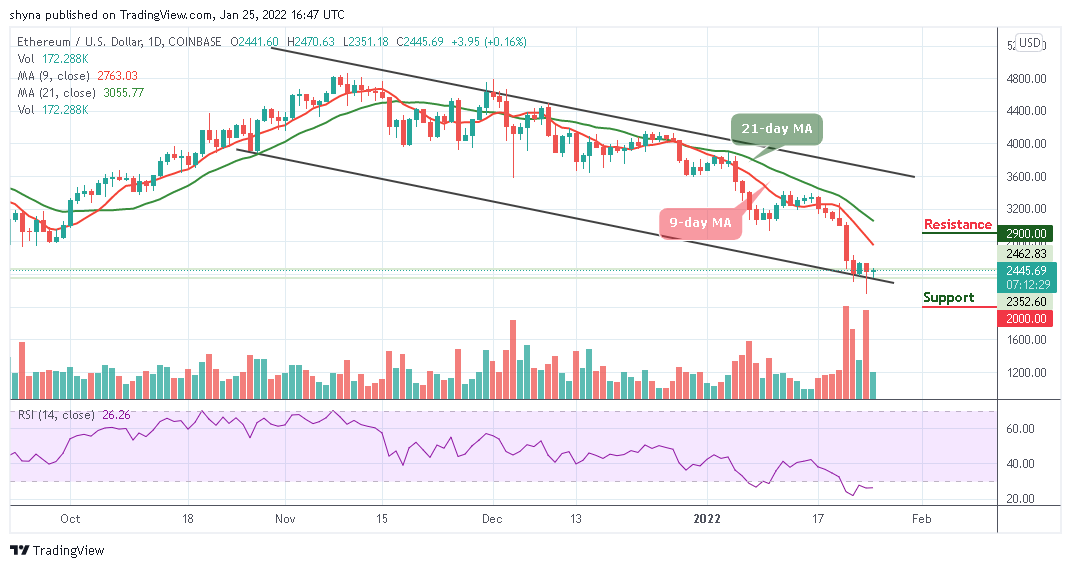
At the time of writing this, the market is falling as ETH/USD recovers from the low of $2351 support level. Looking at the daily chart, this decline is largely attributed to the fact that the Ethereum price may be ready for more downsides. However, ETH/USD remains below the 9-day and 21-day moving averages, but it can move higher if the bulls hold the current market value and push the market to the north. Therefore, if ETH/USD continue to fall and drops beneath the support level of $2200, the coin may remain bearish.
Ethereum Price Prediction: Ethereum (ETH) May Fight to Maintain $2500 Level
According to the daily chart, if the sellers continue to add downward pressure to the Ethereum price, initial support may be expected at $2300. Beneath this, support can then be found at $2000, $1800, and $1600. On the other hand, if the bulls can defend the $2400 level and allow ETH to rebound, an initial resistance is located at $2600. Above this, additional resistance could be located at $2900, $3100, and $3300.
More so, the technical indicator Relative Strength Index (14) is still within the oversold zone showing that the previous bearish momentum may begin to fade. If the technical indicator manages to move out of this region, then the bulls could stand a chance to allow Ethereum to rebound at $2400. However, if it penetrates beneath, the coin may resume a downward spiral.
Against Bitcoin, the market price stays below the 9-day and 21-day moving averages as the coin heads to the south. ETH/BTC is currently trading at the level of 6653 SAT and the bulls couldn’t push the price above the moving averages. Looking at the chart, if the market drops below the lower boundary of the channel, the next key support may likely come at 6000 SAT and below.
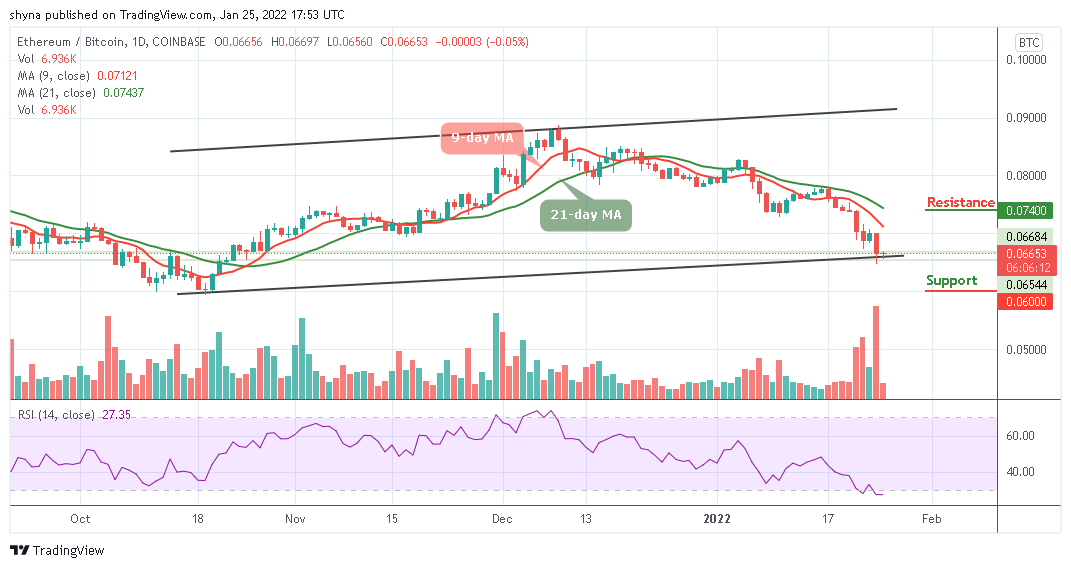
Considering the upside, a possible bullish movement may push the market above the 9-day moving average, when this is done, the resistance level of 7400 SAT and above may be visited. The technical indicator Relative Strength Index (14) is moving in the same direction within the oversold region and this indicates an indecisive in the market movement.
Looking to buy or trade Ethereum (ETH) now? Invest at eToro!
68% of retail investor accounts lose money when trading CFDs with this provider
Join Our Telegram channel to stay up to date on breaking news coverage