Join Our Telegram channel to stay up to date on breaking news coverage
Ethereum Price Prediction – January 21
The Ethereum price prediction is seen moving below the key supports and it may continue to move down towards $2500 if it fails to stay above $2600.
ETH/USD Market
Key Levels:
Resistance levels: $3300, $3400, $3500
Support levels: $2400, $2300, $2200
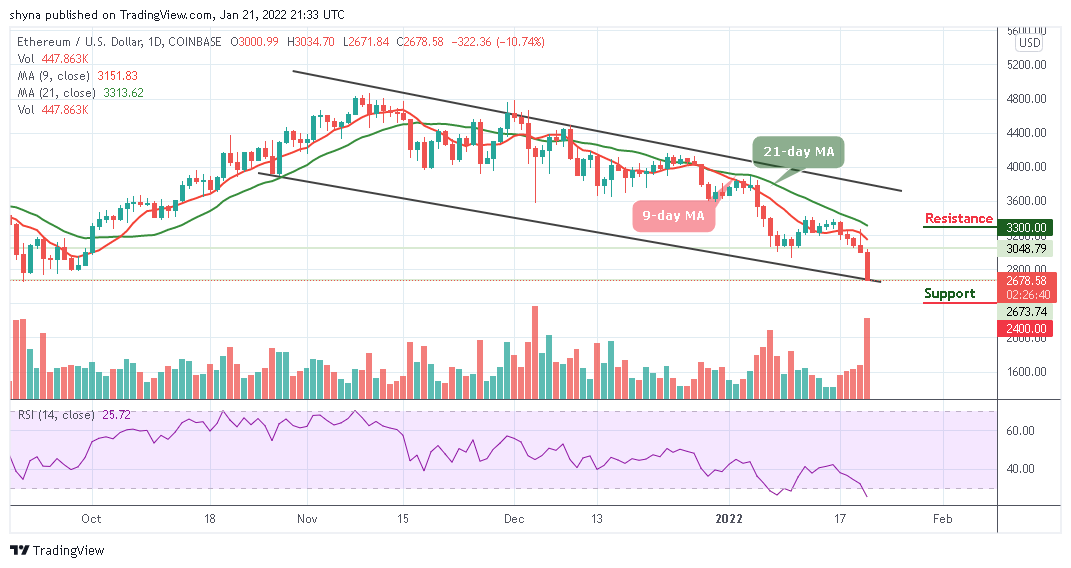
As the market opens today, after touching the high of $3034 level, ETH/USD has been dropping with a bearish bias and currently dropping below the 9-day and 21-day moving averages. The Ethereum price continue to head towards the south and could break many supports below $2600. On the contrary, the price could correct higher, but it is likely to face sellers below the lower boundary of the channel.
Ethereum Price Prediction: Ethereum (ETH) Ready for More Downwards
On the downside, there is a close below the $2700 level as the Ethereum price moves to cross below the lower boundary of the channel. As a matter of fact, dropping further could open the doors for more losses and the price may tumble below the $2600 level. More so, should it spike below this level, the critical support levels of $2400, $2300, and $2200 may come into focus as the technical indicator Relative Strength Index (14) nosedives into the oversold region.
Moreover, ETH/USD is not yet ready to recover above $2700 and it could extend its decline. On the upside, the next major resistance is near the $3000 level. However, the price must climb above the 9-day moving average to hit the resistance levels of $3300, $3400, and $3500 to move back into a positive zone. If not, there is a risk of more downsides below the channel.
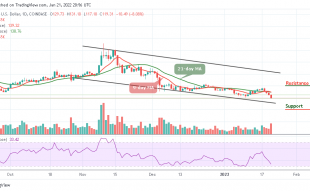
Against Bitcoin, the daily chart shows that Ethereum’s price is trading below the 9-day and 21-day moving averages. If the price crosses below the lower boundary of the channel, there is a possibility that the coin could fall lower and the next support key below 0.070 BTC is close to the 0.068 BTC level. If the price keeps falling, it could hit the critical support of 0.066 BTC and below in the negative move.
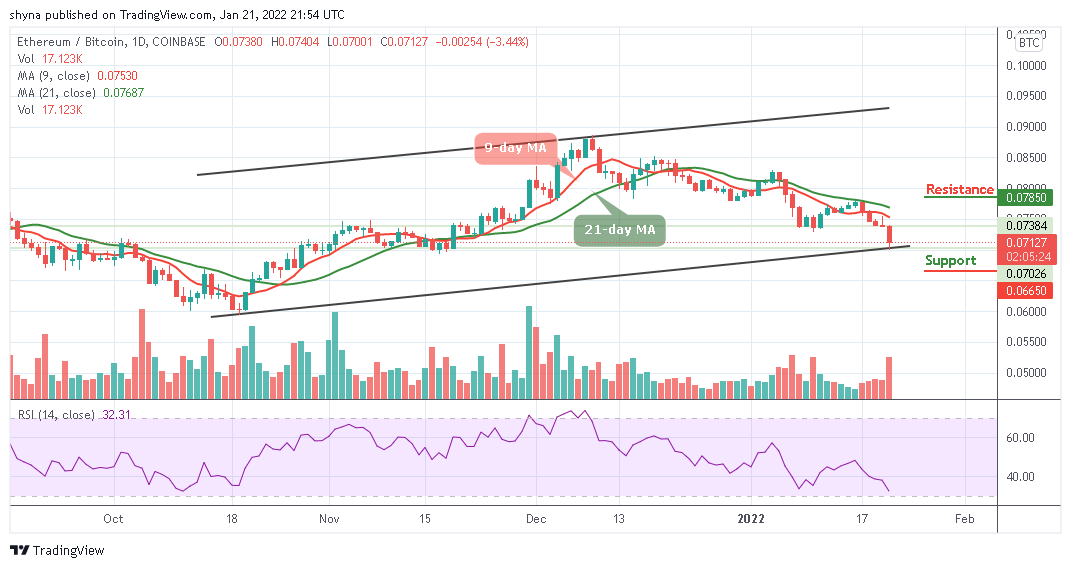
Meanwhile, if the bulls regroup now, the 0.074 BTC and 0.075 BTC resistance levels may play out before heading to the potential resistance levels of 0.078 BTC and above. However, the daily outlook is looking bearish as the Relative Strength Index (14) moves to cross into the oversold region to enhance the bearish movement.
Looking to buy or trade Ethereum (ETH) now? Invest at eToro!
68% of retail investor accounts lose money when trading CFDs with this provider
Join Our Telegram channel to stay up to date on breaking news coverage