Join Our Telegram channel to stay up to date on breaking news coverage
ETH Price Prediction – December 18
The Ethereum price is currently correcting gains, but dips are likely to be limited below $630 in the near term.
ETH/USD Market
Key Levels:
Resistance levels: $750, $770, $790
Support levels: $550, $530, $510

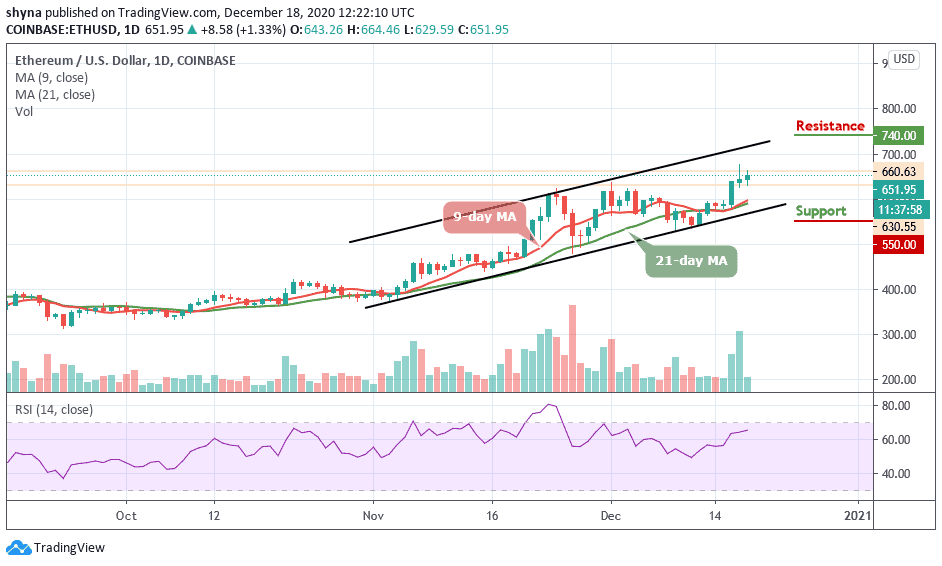
ETH/USD is currently recovering above $640 and it is likely to climb back above $675 soon. Ethereum has remained relatively flat for the past two weeks as bulls and bears are fighting for the $600 level. The yearly-high remains at $677.05 with the nearest support level located at $580 in the short-term.
What to Expect from Ethereum
According to the daily chart, ETH/USD is currently testing the resistance level of $650. Meanwhile, a further bearish movement in price towards the resistance level of $750, $770, and $790 may be visited as the 9-day MA is seen crossing above the 21-day MA. However, should in case the bulls’ momentum fails to break above the resistance level of $$700, the market price may reverse and face the south.
Moreover, as the technical indicator RSI (14) remains above 60-level, the nearest resistance is located towards the upper boundary of the channel at the $700 level. If there is a bearish break below the moving averages, ETH/USD could test the $590 support. The next major support is near the $570 level, where the bulls are likely to take a strong stand. Any further losses could lead the price towards the $550, $530, and $510 support levels.
When compares with Bitcoin, the market price has been moving sideways for the past one month trading below the 9-day and 21-day moving averages. Meanwhile, the technical indicator RSI (14) is revealed moving below 40-level giving a slight bearish confirmation.

However, if the coin remains above 0.028 BTC, buyers might push the market price above the moving averages. More so, once a breakout occurs, traders may expect an immediate resistance at 0.031 BTC and above. Below the channel, the key support levels lie at 0.025 BTC and below.
Join Our Telegram channel to stay up to date on breaking news coverage

