Join Our Telegram channel to stay up to date on breaking news coverage
BCH Price Prediction – December 18
Bitcoin Cash (BCH) rides the bulls on the daily chart as the coin attempted breakout that could lead to a push above $330.
BCH/USD Market
Key Levels:
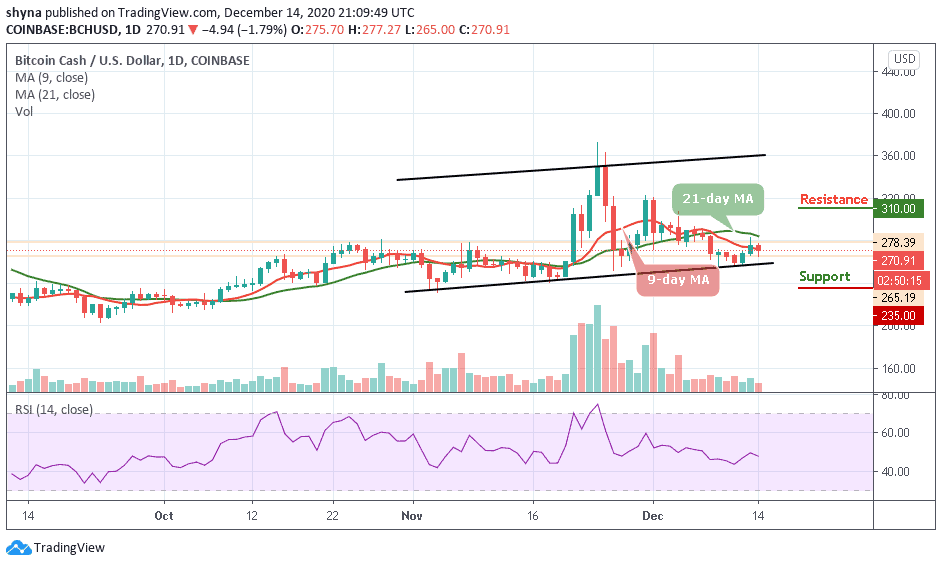
Resistance levels: $350, $360, $370
Support levels: $270, $260, $250
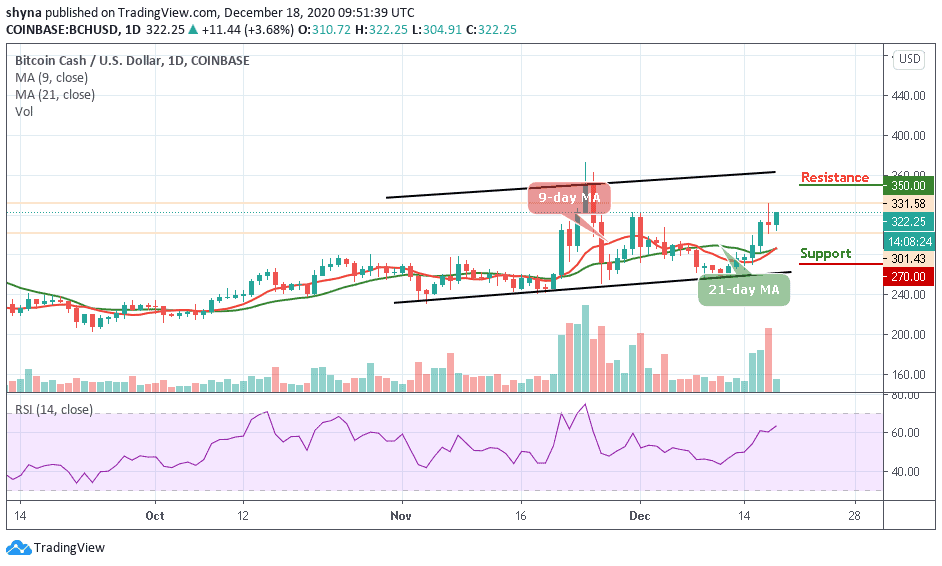
BCH/USD is extremely bullish and if the trading volume can continue to increase significantly, a bullish run is likely to occur. Following the recent price, Bitcoin Cash is currently facing a potential resistance at the $325 level across the 9-day and 21-day moving averages. A break above the $330 level is likely to produce a huge green candle to the upside, marking resistances at $350, $360, $370 levels and above.
Where is BCH Price Going Next?
As we can see in the daily chart, any bearish movement below the moving averages may likely roll the market back to $280 support, if the bulls fail to hold this support, a possible break down to $270, $260, and $250 supports may be visited, and this may establish a new monthly low for the market.
Looking at the chart, we can see that the technical indicator, RSI (14) signal line is moving above the 60-level due to the price increase where a precise bullish cross might reveal more buy signals for the market.
BCH/BTC Market
Against Bitcoin, BCH performance has been very low due to a recurring bearish sentiment which has caused the market to fall drastically. As the price focus on the downside, bears are posing an additional threat for buyers to reach the nearest support level. More so, any further bearish movement may cause the coin to collapse.
However, if the bulls succeeded in breaking the upper side of the channel, the market price may likely reach the next resistance level of 1600 SAT and above. On the other hand, a retest could allow the pair to hit the critical supports at 1150 SAT and below. Meanwhile, the technical indicator RSI (14) is moving below the 40-level as the market remains at the downside.
Join Our Telegram channel to stay up to date on breaking news coverage