Join Our Telegram channel to stay up to date on breaking news coverage
ETH Price Prediction – November 15
The Ethereum price surges from $480 to $454 in the past two days, the market price may test another support in the coming trading sessions.
ETH/USD Market
Key Levels:
Resistance levels: $500, $510, $520
Support levels: $425, $415, $405

ETH/USD experiences a small price decline today as the coin currently trades at $458.46. The coin continues to be supported at the $450 level but it seems that the bears are adamant to push the coin lower. More so, Ethereum has lost over 0.59% within 24 hours.
Where is ETH Price Going Next?
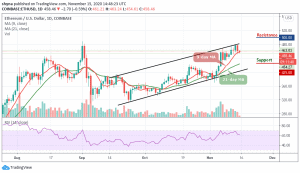
According to the daily chart, ETH/USD keeps trending in red within the channel formation, now trading below the 9-day moving average but yet to get to the 21-day moving average. However, after the opening of the market today, the daily price chart shows that ETH/USD falls from $463.24 to touch the daily low at $454.61, where it found short-term support and later bounced up to $458.46, where it is currently trading.
Meanwhile, for a backward movement, the market can be supported at $425 and $415 levels, if the price falls below the previous levels; another support is around $405. But should in case the price exceeds the indicated level by moving upward, then, the resistance levels of $500, $510, and $520 could be visited. The RSI (14) nosedives below 40-level, which may continue to give more bearish signals.
Against Bitcoin, the Ethereum is seen following the downward as the price breaks down after touching the 2885 SAT today. The technical indicator RSI (14) is likely to nosedives below 40-level, suggesting more bearish signs for the market.
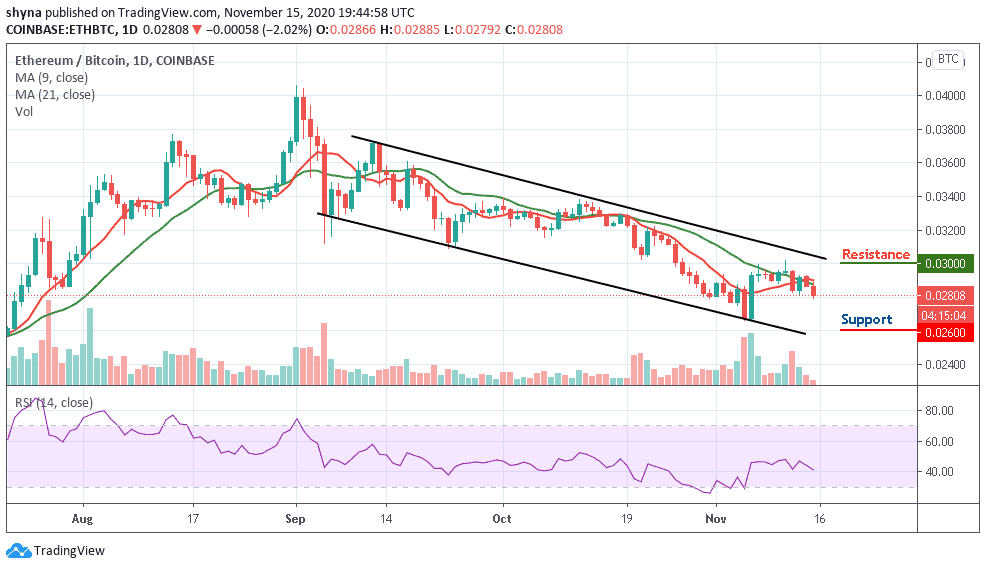
Furthermore, the market may continue to decline if the sellers put more pressure on the buyers, the support levels are located at the 2600 SAT and below. Therefore, if there is a rebound, the Ethereum price may likely break above the moving averages to hit the resistance level of 2600 SAT and above.
Join Our Telegram channel to stay up to date on breaking news coverage