Join Our Telegram channel to stay up to date on breaking news coverage
Bitcoin (BTC) Price Prediction – November 14
At the opening of today’s trading, BTC/USD slides toward the 9-day MA with over 1.37% loss as it trades at the $15,800 level.
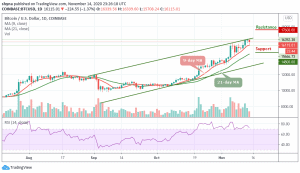
BTC/USD Long-term Trend: Bullish (Daily Chart)
Key levels:
Resistance Levels: $17,600, $17,800, $18,000
Support Levels: $14,800, $14,600, $14,400

BTC/USD failed to break above the previous resistance levels within the ascending channel with the current consolidation pattern. The coin fails to close above the $16,300 level and it may likely see a sharp drop below the 9-day and 21-day moving averages if the bears put more pressure. Similarly, the first level of support is located below the 9-day moving average at $15,000. Beneath this, support lies at $14,800, $14,600, and $14,400 levels.
Where is BTC Price Going Next?
As the daily chart reveals, BTC/USD could not break above the resistance level at $16,300, the coin may set up another few days of negative price declines beneath $16,500. A break above the previous level would have set Bitcoin up to touch the $10,000 level. Meanwhile, the technical indicator RSI (14) may remain within the overbought zone.
However, we can clearly see Bitcoin bouncing back from the daily low. The Bitcoin price touches$15,708 but quickly rebounds above the $16,000 level. Although the candle is still yet to close, however, it does look unlikely that the bulls may end up closing above this resistance. Meanwhile, towards the upside, resistance lies at $17,600, $17,800, and $18,000.
BTC/USD Medium-Term Trend: Bullish (4H Chart)
The 4-hour chart shows that the Bitcoin bulls are now stepping back into the market pushing the BTC price above its previous resistance level that existed around $16,000. Although the Bitcoin price has not yet closed above it, it’s still in the loop of making a serious bounce back.
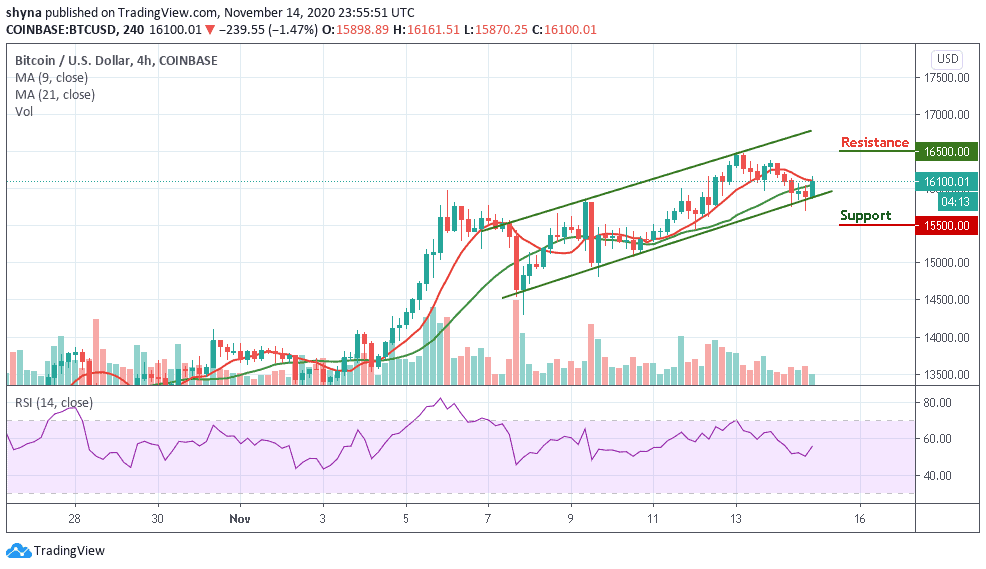
At the moment, BTC/USD is currently trading above the 9-day and 21-day moving averages. The upward movement may likely push the price nearest resistance at $16,500 and above while the immediate support lies at $15,500 and below. The technical indicator RSI (14) is facing the north, which indicates additional bullish signals into the market.
Join Our Telegram channel to stay up to date on breaking news coverage