Join Our Telegram channel to stay up to date on breaking news coverage
LTC Price Prediction – November 14
Litecoin (LTC) faces a sharp price decline of around 4.03% at the time that the market opens and it currently trades at $63.35.
LTC/USD Market
Key Levels:
Resistance levels: $70, $72, $74
Support levels: $56, $54, $52
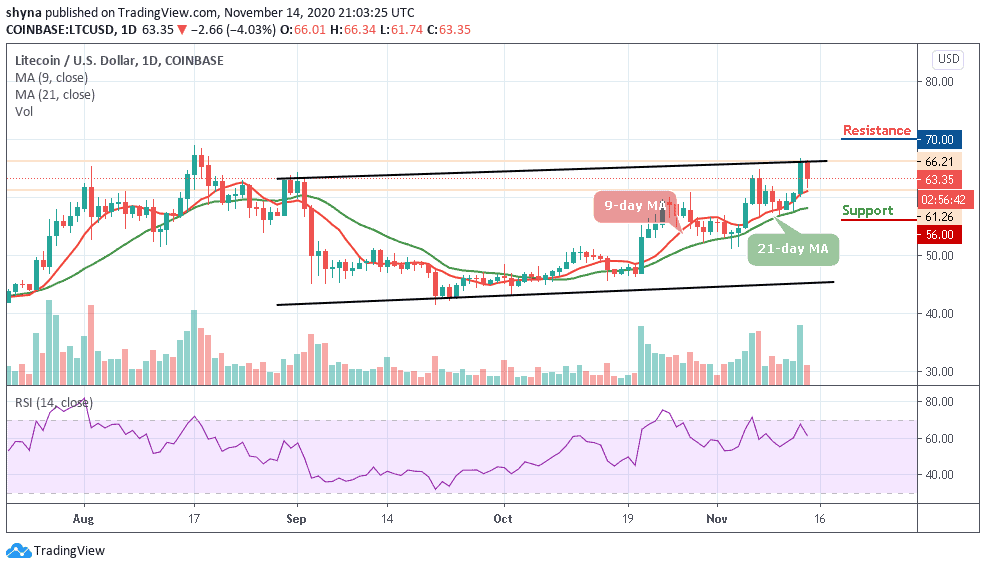
LTC/USD is currently trading in red as the coin slides toward the 9-day moving averages. A few hours ago, the cryptocurrency couldn’t break $66 and it’s been rejected. More importantly, the bulls need to climb above $65 convincingly as a clear break of $66 could take the coin up to the $68 level.
What to Expect from Litecoin (LTC)
According to the daily chart, the Litecoin price touches the daily low of $61.74, therefore, if the nearest support of $60 gives way, the sell-off may come to play and it may be extended towards the psychological $58. Meanwhile, the bearish scenario may be more dominant if the sellers continue to post firm commitment as the technical indicator RSI (14) shows a downward trend, indicating the latest selling pressure on the market.
In addition, traders could see a sharp drop below the 9-day and 21-day moving averages. Breaking this barrier could further weaken the market to $56, $54, and $52. In other words, a higher possible swing may likely retest the previous resistance levels above the upper boundary of the channel. Meanwhile, if the buyers manage to fuel the market more, traders may expect a further increase to $70, $72, and $74 resistance levels.
When compares with Bitcoin, LTC is still trading at the downside. Although the coin recently exploded above the 9-day and 21-day moving averages yesterday. LTC/BTC begins to fall towards the 3900 SAT. The critical support level is located below the channel at 3600 SAT and below.
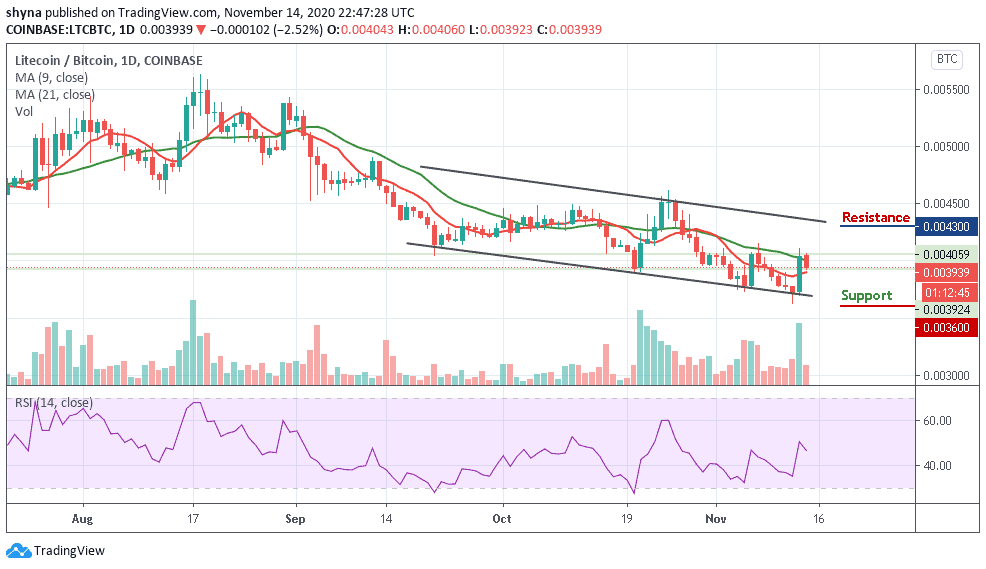
However, the bulls need to re-power the market for the coin to cross above the moving averages, any further bullish movement towards the upper boundary of the channel may likely hit the resistance level at 4300 SAT and above. On the other hand, the Litecoin price is currently hovering below the 9-day MA as the RSI (14) nosedives below 50-level.
Join Our Telegram channel to stay up to date on breaking news coverage