Join Our Telegram channel to stay up to date on breaking news coverage
ETH Price Prediction – September 28
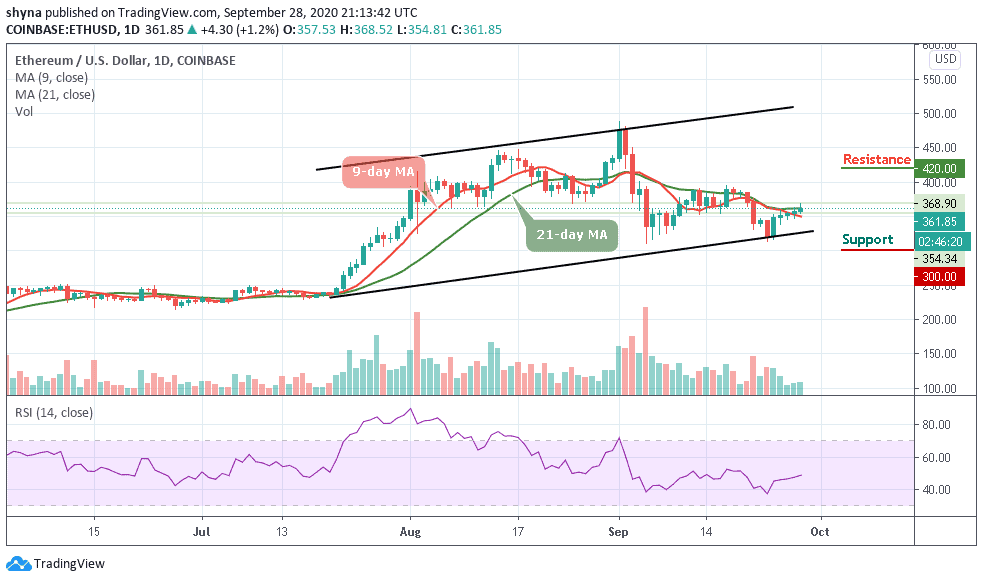
ETH/USD is still struggling to stay above $380 as the entire market takes a brief pause.
ETH/USD Market
Key Levels:
Resistance levels: $420, $440, $460
Support levels: $300, $280, $260

ETH/USD is currently recovering above $360 and it is likely to climb back above $380 soon. Ethereum has been trading bullishly since the past four days and the coin is now trading above the 9-day and 21-day moving averages. The monthly-high remains at $488.95 while the nearest support level for the current trading is located at $330 in the short-term.
What to Expect from Ethereum (ETH)
If Ethereum price breaks and remains above the moving averages, it could test the $380 resistance. However, a successful break above this level could open the doors for a fresh increase above the $400 level. In the mentioned case, the price is likely to rise towards the $420, $440, and $460 resistance levels in the coming sessions.
Moreover, as the technical indicator RSI (14) moves around 49-level, the nearest support is located around the 9-day MA at the $350 level. If there is a bearish break below this support, ETH/USD could test the $320 support. The next major support is near the $300 level, where the bulls are likely to take a strong stand. Any further losses could lead the price towards the $280 and $260 support levels.
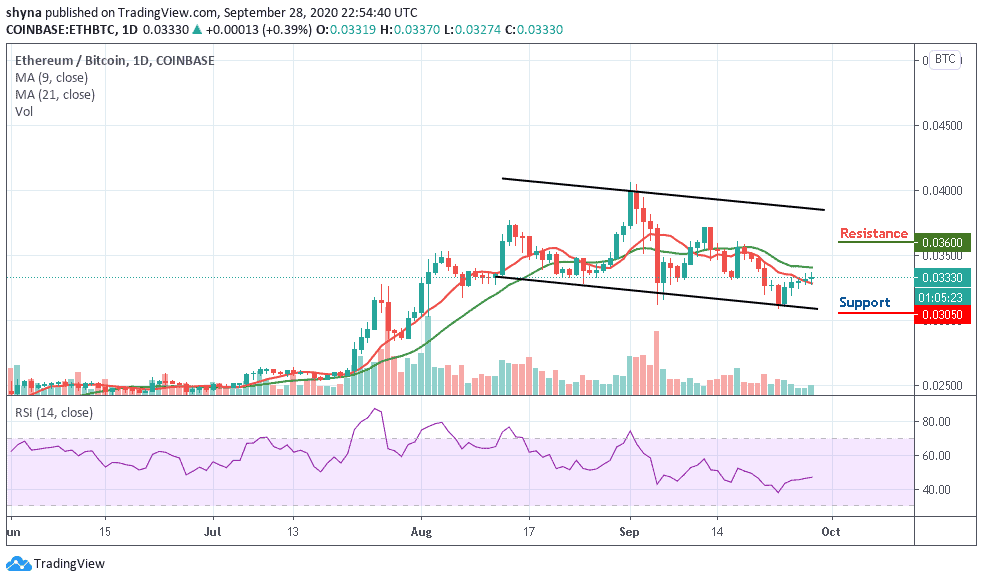
When compares with Bitcoin, the daily chart shows that Ethereum’s price is trading well in an uptrend around 0.0333 BTC. As soon as the price is above the 21-day MA, there is a possibility that additional benefits may be obtained in the long term. The next resistance key above 0.0340 BTC is close to the 0.0350 BTC level. If the price keeps rising, it could even break the 0.0360 BTC and above in future sessions.

Meanwhile, if the bears resume back, the 0.0305 BTC and 0.0302 BTC support may play out before rolling to the critical support at 0.0300 BTC and this may create a new weekly low for the pair. However, the daily outlook is looking bearish as the RSI (14) is moving around 46-level, which may indicate a sideways movement for the market.
Join Our Telegram channel to stay up to date on breaking news coverage

