Join Our Telegram channel to stay up to date on breaking news coverage
Bitcoin (BTC) Price Prediction – September 28
The Bitcoin price is in the hands of the buyers as confidence in the bullish market mounts.
BTC/USD Long-term Trend: Bullish (Daily Chart)
Key levels:
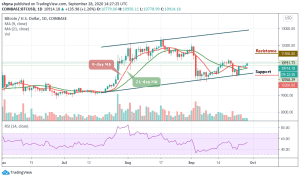
Resistance Levels: $11,500, $11,700, $11,900
Support Levels: $10,200, $10,000, $9,800

BTC/USD is making a surprising move above the 9-day and 21-day moving averages as the coin touches the daily high of $10,956. Looking at the past daily charts, we can clearly see that the current bullish movements started upon breaking the resistance level of $10,828 on September 26, and most importantly, breaking above the moving averages.
Where is BTC Price Going Next?
Bitcoin is currently trading above the 9-day and 21-day moving averages at $10,914 The movement happened in less than one hour after Bitcoin started today’s trading at $10,778 which is an important support level on the daily chart but the bulls managed to maintain the upward movement.
However, it is important to note that Bitcoin’s inability to post any sustained closes within the $10,900 region shows that it is currently plagued by underlying weakness. This consolidation phase has given rise to a plethora of bearish divergences that may cause the cryptocurrency to see a notable retrace in the days ahead.
Moreover, the potential resistance levels for the coin are located at $11,500, $11,700, and $112,900 while the critical supports lie at $10,200, $10,000, and $9,800 as the RSI (14) moves above 50-level, suggesting more bullish signals.
BTC/USD Medium-Term Trend: Bullish (4H Chart)
On the 4-hour chart, BTC/USD touches a high of $10,956 after the price breaks above the 9-day and 21-day moving averages. However, as the technical indicator RSI (14) moves at 60-level, the upward move may be facing the resistance above the recent high.

Meanwhile, on the downside, if the market price retraces and breaks below the moving averages within the ascending channel, the coin may further depreciate to the support of $10,650 and below. In other words, if the price retraces and finds another resistance above the channel, the uptrend could resume into the previous highs to hit the resistance at $11,100 and above.
Join Our Telegram channel to stay up to date on breaking news coverage