Join Our Telegram channel to stay up to date on breaking news coverage
EOS Price Prediction – September 11
The trading situation in the EOS business operation shows that it attempts to push higher against the market worth of the US currency over a while. In the last fifty-two weeks, the crypto’s price witnessed a low and a high of $0.8232 and $1.89 value-lines. The crypto economy trades around the $1.77 line at an average of 1.79% positive.
EOS Price Statistics:
EOS price now – $1.77
EOS market cap – $1.8 billion
EOS circulating supply – 1 million
EOS total supply – 1.1 billion
Coinmarketcap ranking – #35
EOS/USD Market
Key Levels:
Resistance levels: $2, $2.25, $2.50
Support levels: $1.40, $1.20, $1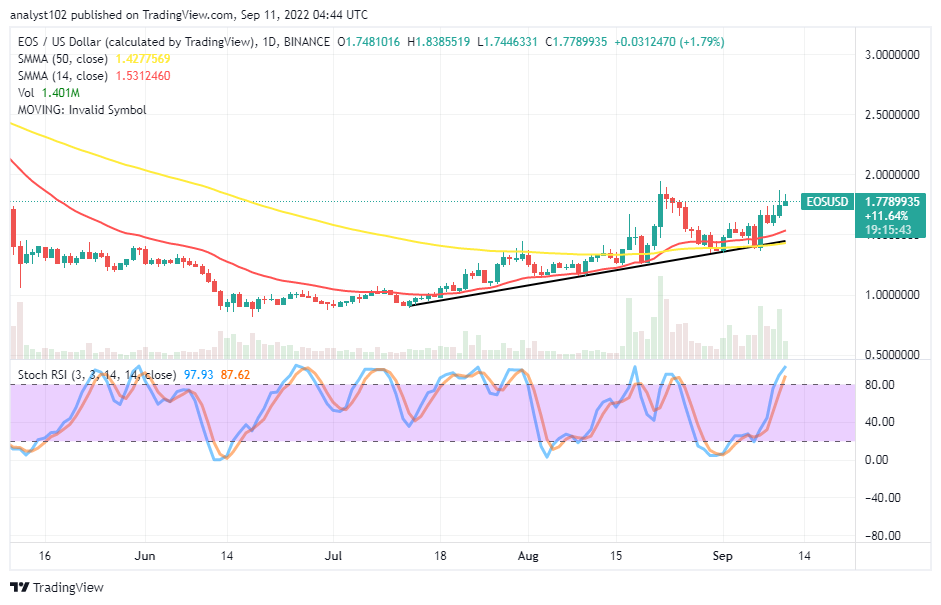 EOS/USD – Daily Chart
The EOS/USD daily chart showcases the crypto economy’s price attempts to push higher through resistances above the trend lines of the SMAs. Presently, the 14-day SMA indicator is at $1.53 above the value line of the 50-day SMA indicator at $1.43. The Bullish trend line strategically drew to touch the bottom line where each bullish candlestick had stepped. The Stochastic Oscillators have penetrated the overbought region to reach 87.62 and 97.93 range values.
Your capital is at risk.
What is the trending outlook like at this moment in the EOS/USD trade activities?
As of the time of writing this analysis, the trending outlook in the EOS/USD trade still has some upward forces to the north side as headlined that the crypto attempts to push higher. Much emphasis has to lay on the $2 resistance level by ensuring a sustainable breakout in pursuance of the current bullish motions to a continuation mode. When that assumption materializes, long-position takers may only allow buying orders about five days back to run with the method of trailing their positions.
On the downside of the technical analysis, going by the pace at which the market price is pushing in the upside direction, selling orders may have to suspend until the convergence of candlesticks resurfaces around a higher-resistance trading spot. After days of operation from now, 4-hour and 1-hour time frames may be instrumental in detecting an early price action that can prompt a decent sell entry afterward. Sellers need to watch out for a complementary condition between them before the execution.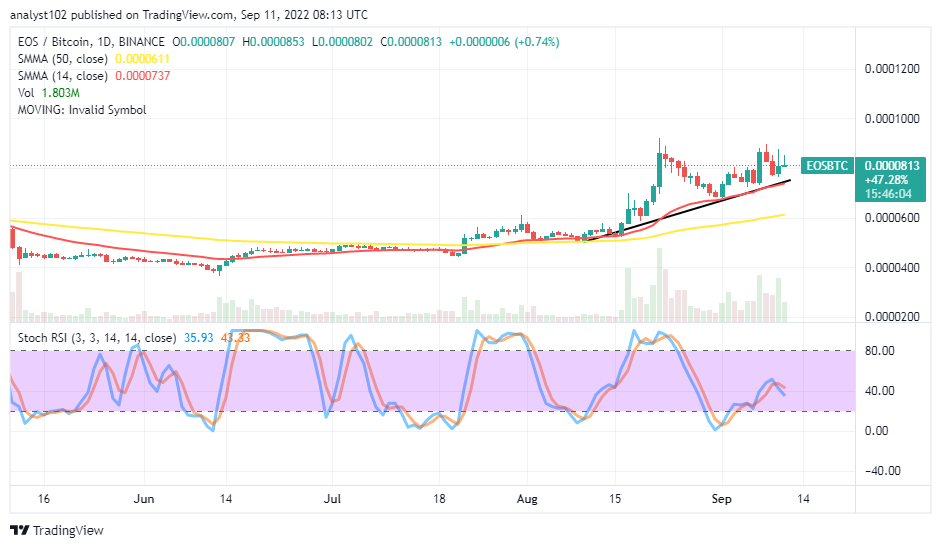
EOS/BTC Price Analysis
EOS’s trending weight compared with Bitcoin has maintained a northward-trending outlook despite the ups and downs over the buying signal side of the SMAs. The 14-day SMA indicator is above the 50-day SMA indicator. The bullish trend line drew alongside the smaller SMA. The Stochastic Oscillators have initially moved northbound from the oversold region to now get slightly crossed southbound to the range points of 43.33 and 35.93. That portends the base crypto may downsize in its momentum for a while against the counter trading crypto.
Read more:
Join Our Telegram channel to stay up to date on breaking news coverage