Join Our Telegram channel to stay up to date on breaking news coverage
EOS Price Analysis – June 4
The price of the EOS has been drastically reduced in the chart today, June 4, 2019. The fall in the price of the EOS is considered a slowdown, and the same may continue in the coming days.
EOS/USD Market
Key Levels:
Supply levels: $11, $12, $13
Demand levels: $4.1, $3.1, $2.1

In the last two days, the EOS market has moved around the corner, following a bearish flag pattern. The market has been strongly bearish in the last 24 hours of trading and is currently experiencing a sharp decline, as its price has successfully exceeded the 21-day moving average (MA). In the upward movement, one can expect the market to get an immediate supply of $11 or more.
In addition, the daily chart shows that the price is returning to the low-cost demand levels of $4.1, $3.1 and $2.1 respectively. The signal line RSI 14 is moving down in the daily schedule, the indicator now approaches the neutral level. The MACD indicator in the daily chart is still bullish, although downward pressures have begun to strengthen.
EOS/BTC Market
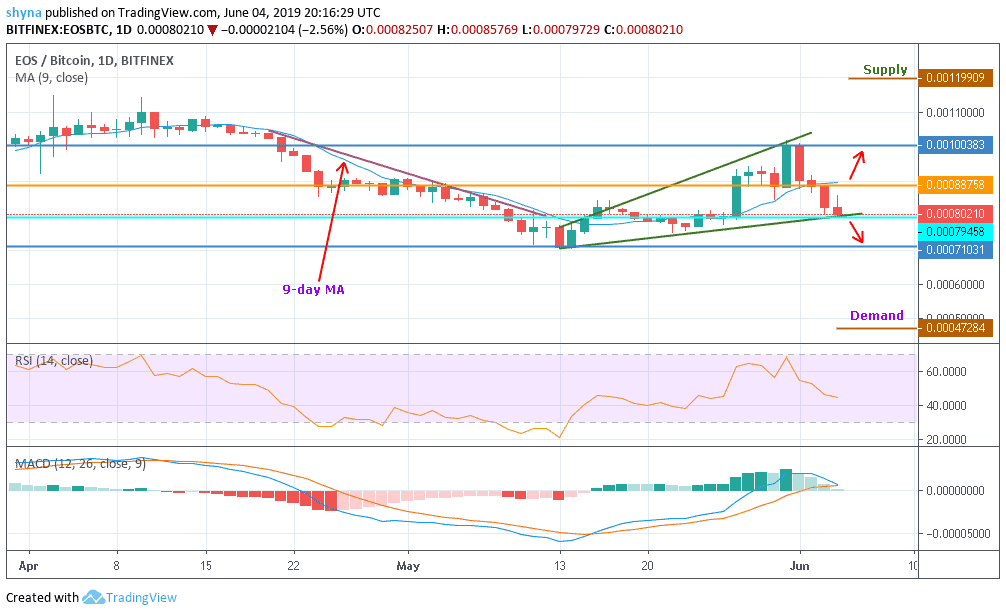
The bearish scenario is strengthening for the EOS market, as market prices remain below the 9-day moving average – blue line. Significantly, sellers have taken control of this market as more sales are expected by immersion in future trading. In comparison with the BTC, the level of demand in this range is built around 0.00047BTC, while the supply is set at 0.0012BTC.

Obviously, the RSI 14 on the chart has revealed at level 50 after the last 4days drop. The decline was also signaled on the important yellow line with a low cross. In case of price increases, we can expect a buying pressure at the 0.0012BTC supply level and above.
Please note: Insidebitcoins.com is not a financial advisor. Do your own research before investing your funds in any financial asset or presented product or event. We are not responsible for your investing results.
Join Our Telegram channel to stay up to date on breaking news coverage


