Join Our Telegram channel to stay up to date on breaking news coverage
Electroneum Price Analysis (ETN) – July 17
After a great rise since early July 2019, ETN suffered a sharp drop in price. Meanwhile, in the future, ETN should continue to grow high in the market.
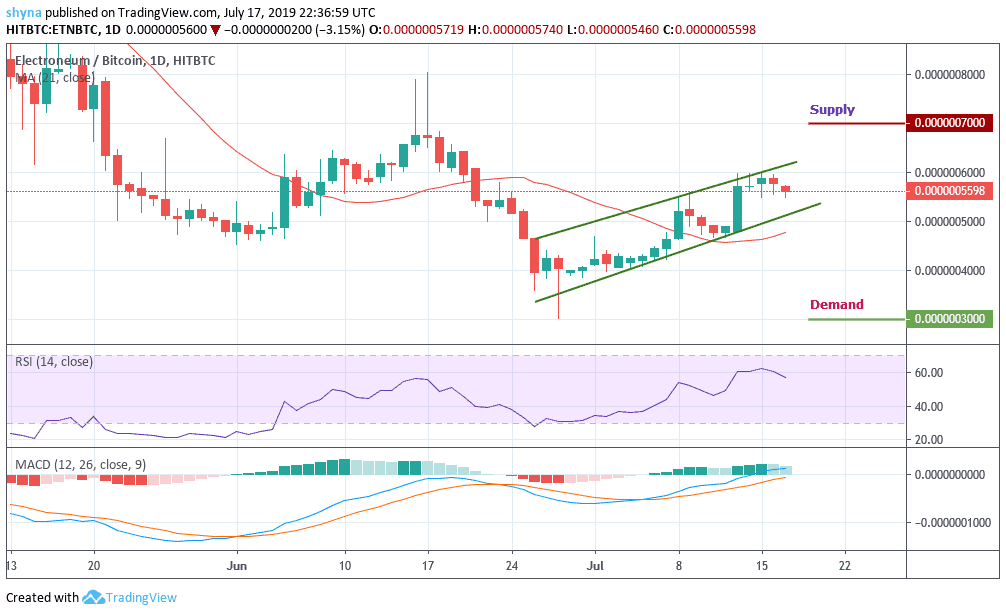
Long-term Trend ETN/BTC: Bullish (Daily Chart)
Key levels:
Supply levels: 7000SAT, 7500SAT, 8000SAT
Demand Levels: 3000SAT, 2500SAT, 2000SAT

Electroneum was raging in the market yesterday. The coin jumped to different places as shown in the chart. The coin is ranked 100th in the crypto market. The same thing helped the coin attract more traders. The coin is experiencing a sharp drop in price currently.
Looking at the daily chart, the RSI signal line (14) is moving upward above the 50-level and 21-day moving average, while the MACD indicator is generating bullish signals which indicate that the bulls could take control of the market for a while, aiming at the 7000SAT supply level, otherwise, it drops to meet the demand at 3000SAT.
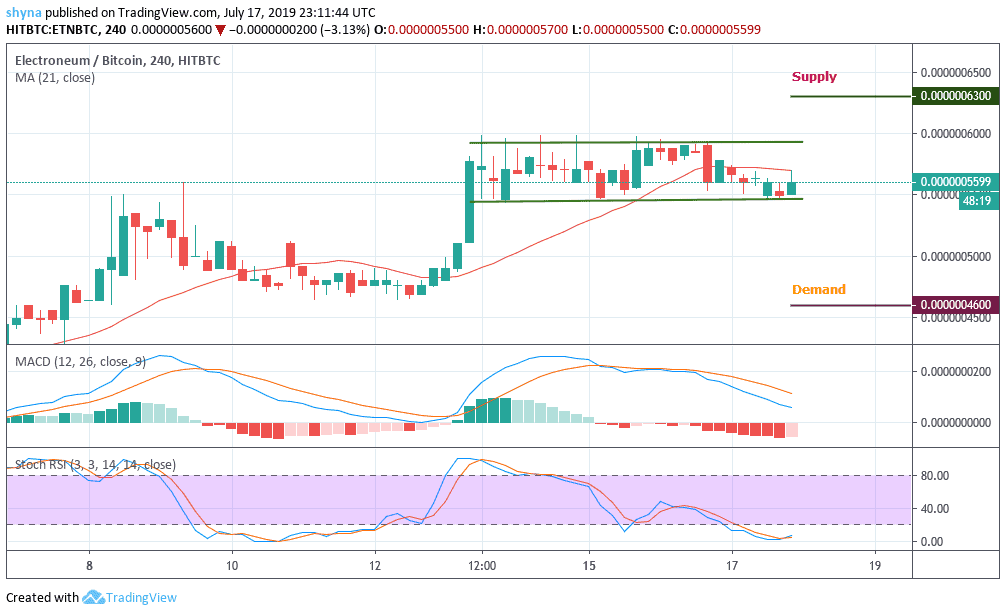
Medium-term Trend ETH/BTC: Ranging (4H Chart)
Against BTC, the ETN price trades in a fairly stable range without forming a distinct trend over a period of time. The action of the prices oscillates rather in a range or a horizontal channel, without the bulls or the bears take control of the market. The MACD and stochastic RSI indicators show that it is possible for the market to fall into a demand level of 4600SAT and 4400SAT respectively.

However, if the Electroneum price decided to climb in a bullish movement, it could touch the supply levels at 6300SAT and 6500SAT. Similarly, traders interested in the coin should have a long term period. The coin should generate considerable profits on investments made during the same period.
Please note: insidebitcoins.com is not a financial advisor. Do your own research before investing your funds in any financial asset or presented product or event. We are not responsible for your investing results.
Join Our Telegram channel to stay up to date on breaking news coverage


