Join Our Telegram channel to stay up to date on breaking news coverage
MANA Price Prediction – June 13
The Decentralend market has shown a recovery signal on a lighter mode as it tries to build up from near lower baseline support. The crypto’s all-time high value stands at $5.90, and its all-time low is at $0.007883, with a return on investment of 3268.53%.
Decentraland (MANA) Price Statistics:
MANA price now – $0.8613
MANA market cap – $1.6 billion
MANA circulating supply – 1.9 billion
MANA total supply – 2.2 billion
Coinmarketcap ranking – #33
MANA/USD Market
Key Levels:
Resistance levels: $1, $1.20, $1.40
Support levels: $0.60, $0.40, $0.20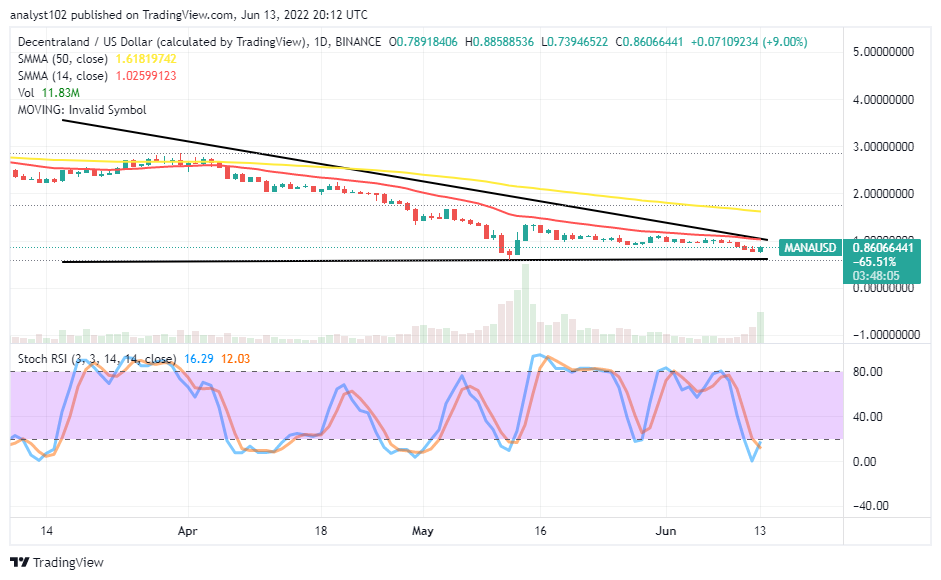
The daily trading chart showcases that crypto has shown a recovery signal in its operations against the US Dollar from beneath the smaller SMA trend line. The 50-day SMA indicator is above the 14-day SMA indicator. The Stochastic Oscillators are in the oversold region, trying to cross the lines northbound against the 20 range. That suggests an upward force is somewhat piling around the current trading zone to let the base trading instrument push back to the upside direction.
Will the MANA/USD market not fall further from its current trading price soon?
The MANA/USD market has to break above the $1 resistance level to deduce it won’t be falling further from its current trading spot as the crypto has shown a recovery signal. Long-position takers needed to be patient to get a buying entry order around a deep-shallow trading zone to avoid fake buying signs. A bullish candlestick formed on lower-time frames of 1-hour could be instrumental in the early order execution.
On the downside of the technical analysis, the MANA/USD market has been positive-responsively, following a bearish trend path around the 14-day SMA trading indicator over several sessions. Presently, the main resistance level is near a spot around the $1 that sellers are to be on the lookout for to launch a position while an active correctional tends to resume. In the event of that assumption not forth happening, around the point, they will have to look out for it within other resistances below the $2 to play out probably.
MANA/BTC Price Chart
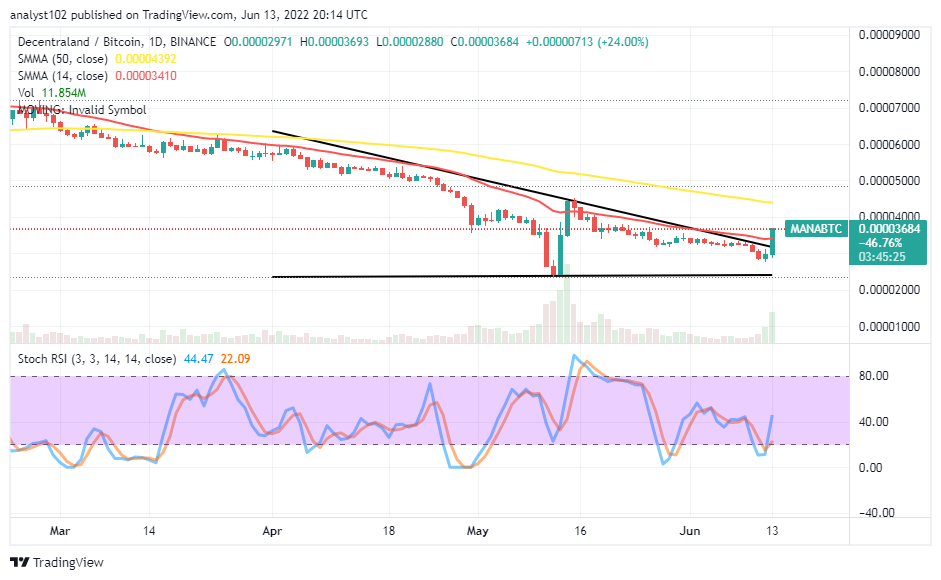
In comparison, MANA trending ability against Bitcoin has just been trying to push northward. The cryptocurrency pair price has shown a recovery signal against the smaller SMA trading indicator. The 50-day SMA trend line is above the 14-day SMA indicator trend line. A bullish candlestick is in the making to possibly propel the subsequent one into a rising outlook. The Stochastic Oscillators have crossed northbound from the 20 range, slightly against the 40 range. The base crypto may be pushing to a high point around the bigger SMA trend line to let the counter crypto gain back the market’s control afterward.
Read more:
Join Our Telegram channel to stay up to date on breaking news coverage
