Join Our Telegram channel to stay up to date on breaking news coverage
The Curve price prediction could set a bullish run if the market can keep the coin above the resistance level of $0.89.
Curve Prediction Statistics Data:
- Curve price now – $0.89
- Curve market cap – $475.8 million
- Curve circulating supply – 531.5 million
- Curve total supply – 1.8 billion
- Curve Coinmarketcap ranking – #73
CRV/USD Market
Key Levels:
Resistance levels: $1.20, $1.30, $1.40
Support levels: $0.60, $0.50, $0.40
Your capital is at risk
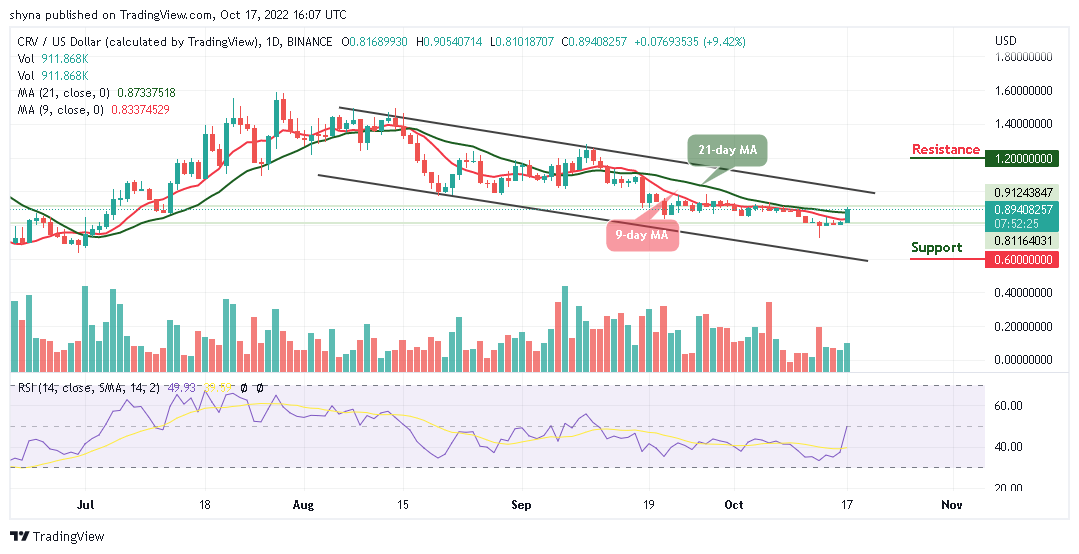
CRV/USD is following a bullish movement above the resistance level of $0.85 with a price growth of 9.42%. For the fact that the coin is recording a tremendous gain, the Curve price may retreat a little before heading to the upside. Meanwhile, traders can expect the price to continue to rise if the bulls keep the coin above the 9-day and 21-day moving averages.
Curve Price Prediction: CRV/USD May Move Upside
The Curve price is on its way above the 21-day moving average at around $0.89. If the price continues to create a bullish movement, traders can then expect a bullish continuation toward the upside. Meanwhile, as the technical indicator Relative Strength Index (14) moves to cross above the 50-level, the possible resistance levels could be found at $1.20, $1.30, and $1.40 in the long term.
However, if the coin keeps the bullish movement for the next couple of days, traders may witness more of it reach higher levels. Meanwhile, the Curve price is trying to create a bullish movement in the short term. On the contrary, any bearish movement below the 9-day moving average could roll the coin back to the supports of $0.60, $0.50, and $0.40.
Against Bitcoin, the Curve price is likely to head toward the upper boundary of the channel as the coin keeps trading above the 9-day and 21-day moving averages. According to the daily chart, there is a need for an increasing volume and resistance to cause an upsurge in the market. At the moment, Curve (CRV) is trading around the 4559 SAT but traders can expect support at 3600 SAT and below if the coin heads to the south.
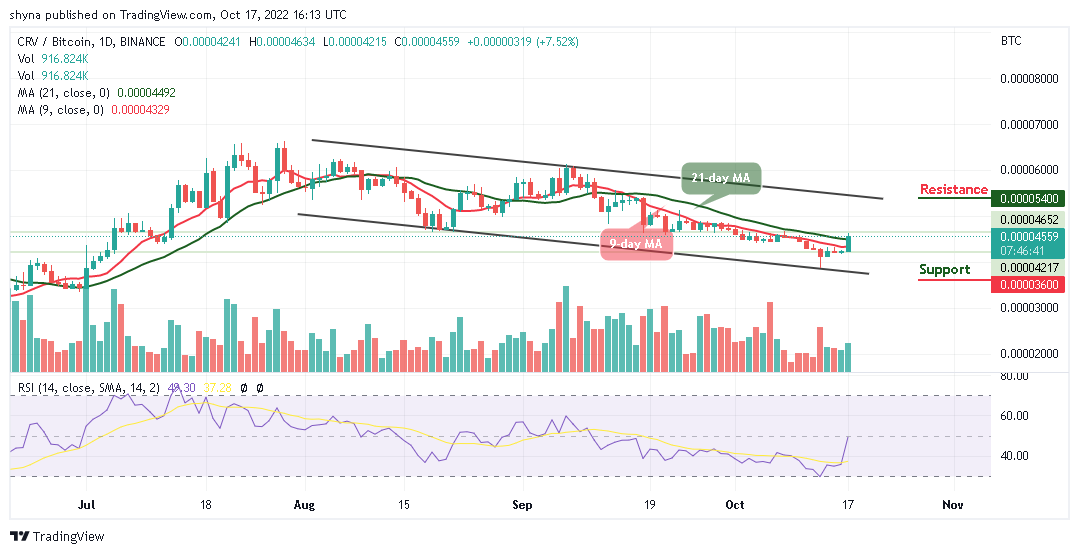
Nevertheless, if a bullish move pushes the price towards the upper boundary of the channel; traders can then confirm a bull run for the coin. Moreover, the closest resistance could be located at 5400 SAT and above as the technical indicator Relative Strength Index (14) moves to cross above the 50-level, suggesting bullish movement.
Join Our Telegram channel to stay up to date on breaking news coverage