Join Our Telegram channel to stay up to date on breaking news coverage
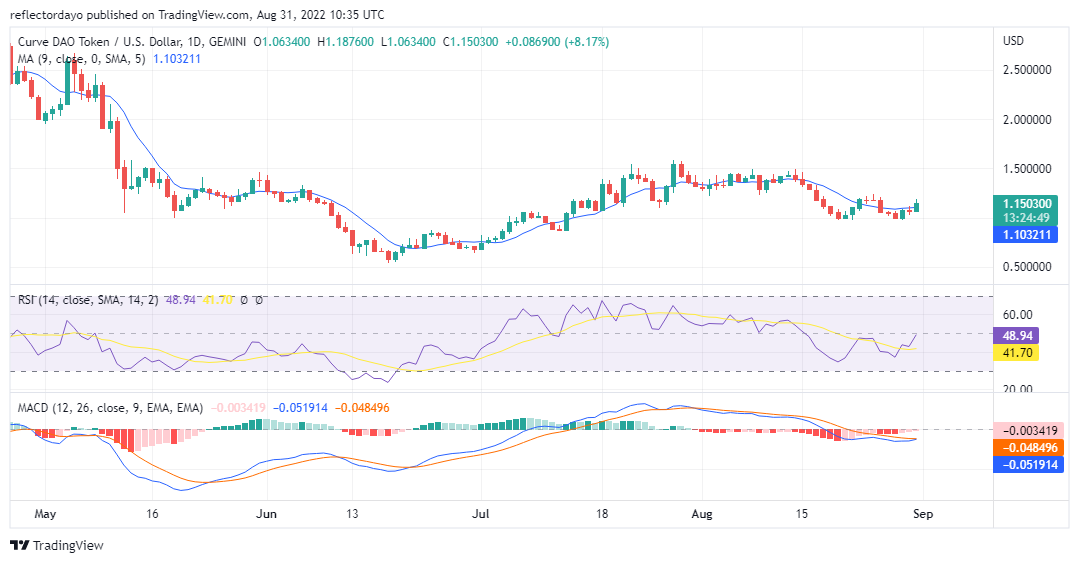
At the resistance level of $0.088009, there is a very significant candlestick pattern that formed to mark the end of the downtrend and also the beginning of an uptrend for CRV/USD. This candlestick pattern is known as a bullish engulfing candlestick pattern. And this pattern formed between the 28th and the 29th of August. The market actions of the following day (the 30th) were, as expected, bullish, but later, the sellers took control of the market. However, later in the day, buyers regained strength, but they were not able to take control of yesterday’s market. In today’s market, buyers are in control and they are driving the price towards the $1.20000 resistance level.
Curve Market Price Statistic:
- CRV/USD price now: $1.160314
- CRV/USD market cap: $ 606,584,620
- CRV/USD circulating supply: 525,358,965.42
- CRV/USD total supply: 1,812,612,400
- CRV/USD coin market ranking: #69
Key Levels
- Resistance: $01.229236, $1.280927, $1.338362
- Support: $01.062675, $0.988009, $0.804218
Your capital is at risk
Curve Market Price Analysis: The Indicators Point of View
The indicators are telling us that the market is trying to come out of the negative zone. In the Relative Strength Index, the RSI line is trying to retrace an upper measurement. At the present, the indicator line is at the threshold of 49.18%. Also, the price action for today is still trying to cross the 9-day moving average. And in the Moving Average Convergence and Divergence indicator, the fast line is about to cross the slow line. What all the indicators are saying is that the price has risen to the threshold of an uptrend. And if the buying pressure continues, the market uptrend will be confirmed.
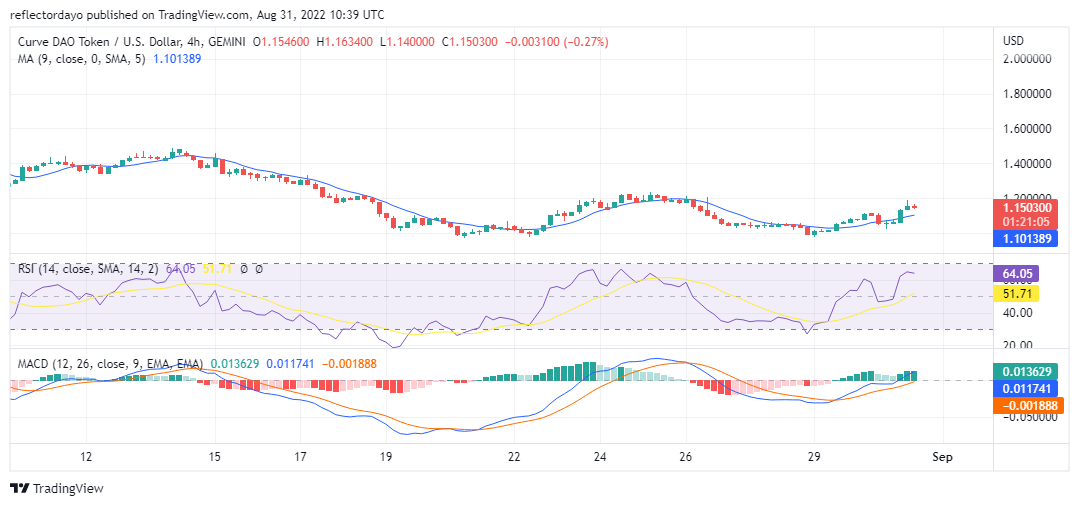
Curve Market Price Analysis: CRV/USD 4-Hour Chart Outlook
In the 4-hour chart, we can see that indicators in this time frame are already pointing to an uptrend. Some of the histograms of the MACD that represent today’s market activities are green. This indicates strong buying pressure and a sign that buyers are still in control. In the third trading session, sellers are trying to take the session, but the activity for this session appears to be weak.
Related
Join Our Telegram channel to stay up to date on breaking news coverage