Join Our Telegram channel to stay up to date on breaking news coverage
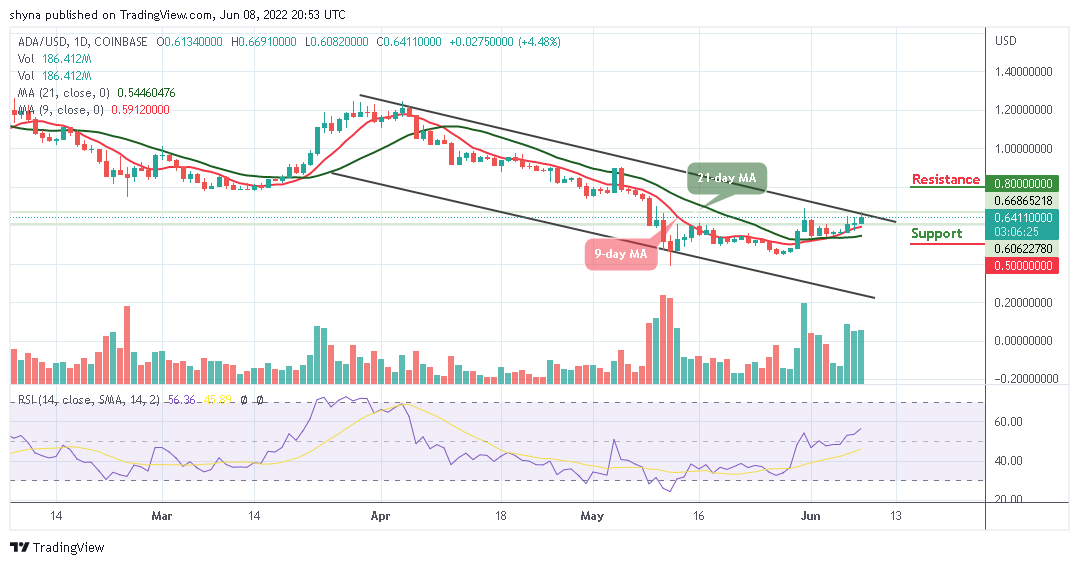
According to the daily chart, after touching the daily low of $0.60, the Cardano price prediction touches a new daily high of $0.66.
Cardano Prediction Statistics Data:
- Cardano price now – $0.64
- Cardano market cap – $21.6 billion
- Cardano circulating supply – 33.7 billion
- Cardano total supply – 34.2 billion
- Cardano Coinmarketcap ranking – #6
ADA/USD Market
Key Levels:
Resistance levels: $0.80, $0.90, $1.00
Support levels: $0.50, $0.40, $0.30
ADA/USD is trading at $0.64 after confirming a daily uptrend and climbing towards the upper boundary of the channel. However, the Cardano is making a triumphant return above the 9-day and 21-day moving averages; therefore, ADA could touch a new daily high at over $0.70 in the next positive direction. At the time of writing, ADA validates the $0.60 level as support, before resuming its upward movement.
Cardano Price Prediction: Cardano (ADA) Ready to Blow Hot
As the daily chart reveals, the 9-day moving average is confidently above the 21-day moving average. The Cardano price is likewise trading at the resistance level of $0.64, which connotes that buyers are gaining upper hand in the market. However, the technical indicator Relative Strength Index (14) is currently moving towards the 60-level, pointing up to indicate a buy signal.
Meanwhile, should in case the buyers be able to push the price above the upper boundary of the channel and the daily candlestick closes above this barrier, the market price may rally towards the resistance levels of $0.80, $0.90, and $1.00, while the supports could be located at $0.50, $0.40, and $0.30 respectively.
ADA/BTC Market: Cardano Price Moves to the North
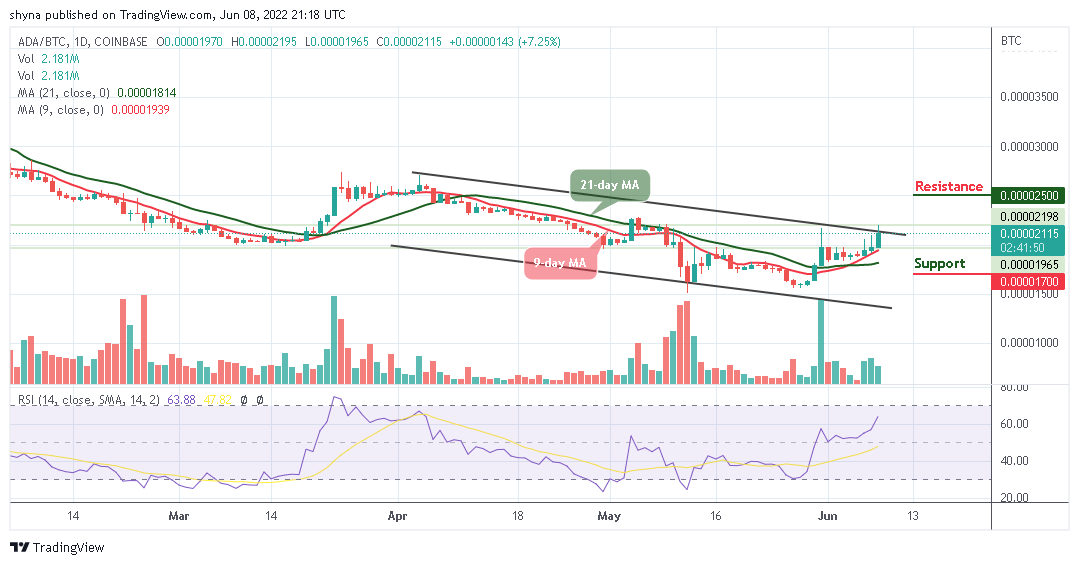
Against Bitcoin, if the Cardano price continues to follow a bullish surge above the 9-day and 21-day moving averages, its price may swing high above the upper boundary of the channel to touch the resistance level of 2500 SAT and above.

Meanwhile, on the contrary, crossing below the 9-day and 21-day moving averages could lead the coin to the support level of 1700 SAT and below. On the technical indicator, the Relative Strength Index (14) signal line is currently moving above the 60-level, pointing up to indicate a bullish movement.
Read more:
Join Our Telegram channel to stay up to date on breaking news coverage


