Join Our Telegram channel to stay up to date on breaking news coverage
Bitcoin (BTC) Price Prediction – April 26
Bitcoin (BTC) marks a notable rise from its recent lows that were set earlier this week.
BTC/USD Long-term Trend: Ranging (Daily Chart)
Key levels:
Resistance Levels: $60,000, $62,000, $64,000
Support Levels: $44,000, $42,000, $40,000
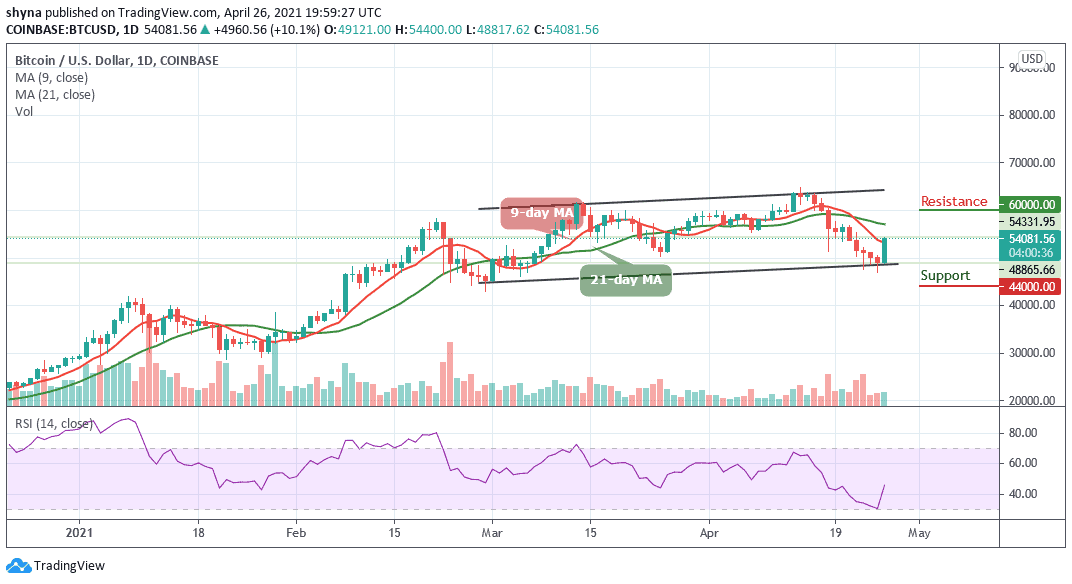
BTC/USD is currently caught within a slight uptrend, as the first digital asset is pushing up towards $55,000 as sellers begin losing their edge over bulls. The upswing comes after multiple tests of its key support between $47,000 and $50,000. The strength of the buying pressure within this level should not be underestimated, as bears were unable to break it despite making several attempts to do so.
What is the Next for Bitcoin?
The strength in BTC’s high time frame market structure seems to indicate that a move up towards $55,000 could be imminent in the near term. At the time of writing, BTC/USD is trading up at its current price of $54,081 which marks a notable rise from recent lows of $48,817 that were set and visited on multiple occasions throughout the past week. However, the bears did not have enough strength to shatter this price region as it appears that bulls now have the upper hand.
Nevertheless, if the market decides to fall, the price of Bitcoin could fall below the lower boundary of the channel at $47,000, and if that support fails to hold the sell-off, traders could see a further decline towards the support levels of $44,000, $42,000, and critically $40,000. All the same, any further bullish movement above the moving averages may hit the resistance levels at $60,000, $62,000, and $64,000 as the RSI (14) moves above 45-level.
BTC/USD Medium – Term Trend: Bearish (4H Chart)
On the 4-hour chart, BTC/USD is still trading above the 9-day and 21-day moving averages. A continuous movement above this barrier could boost the Bitcoin above the psychological resistance at $54,000. For now, the technical indicator RSI (14) reveals that BTC’s uptrend has fuel and is bound to continue. Any further bullish movement from the current value could lead to the potential resistance of $57,000 and above.

On the other hand, the daily range may confirm a bear flag pattern, which means that the BTC’s upward case may be jeopardized. Therefore, it is essential that bulls seize the opportunity and quickly push that breakout towards $54,000. Otherwise, another rejection at $53,500 could prematurely end the uptrend and pull the coin below the moving averages and move towards the support level of $51,000 and below.
Join Our Telegram channel to stay up to date on breaking news coverage