Join Our Telegram channel to stay up to date on breaking news coverage
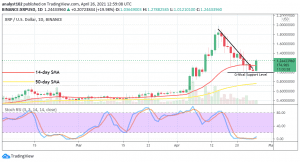
XRP Price Prediction – April 26
There has been a rate of increase in the market valuation of XRP/USD as is pushing on a higher note to the north direction from a low trading area of around $1.
XRPUSD Market
Key Levels:
Resistance levels: $1.50, $1.70, $1.90
Support levels: $0.90, $0.70, $0.50
XRP/USD – Daily Chart
A critical support line has drawn near below the smaller SMA trend-line to mark a starting point of return of the current ongoing beefing bullish candlestick in the market. The smaller SMA has breached to the north as pushes get on an increasing rate through some resistances. The 50-day SMA indicator is still located around the support value of $0.80 to showcase the most probable deadlier extent to any ugly untimely event that can occur to depress the XRP/USD uptrend afterward. The Stochastic Oscillators’ hairs are conjoined in the oversold region. But, they now appear to open the hairs to potentially signify a return of an upswing in this market.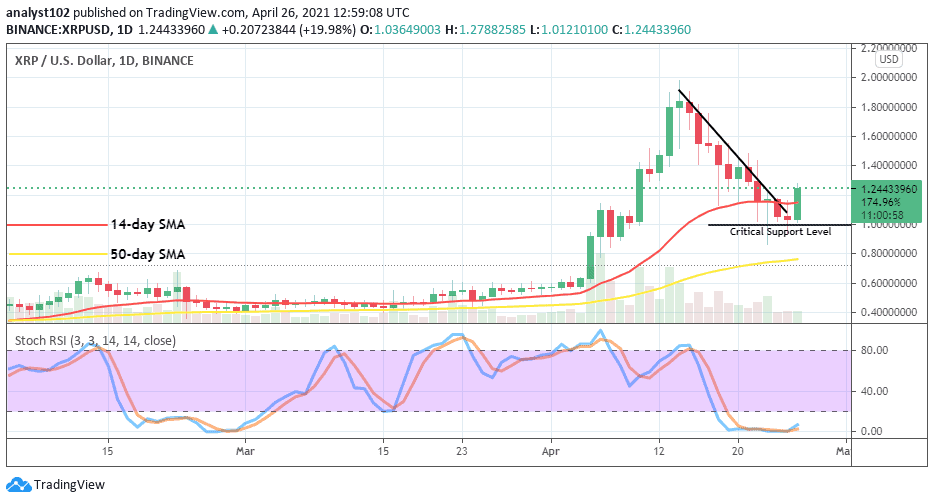
Will the XRP/USD $1 critical support line now serves as a good base for more ups?
About the downside, the XRP/USD trading chart depicts a tougher situation for bears to sustainably stage a come-back in the near sessions. As result, it now calls for a pause in their consideration for a while as long as the current gets no rejection at a higher trading zone. A pit stop may be experienced suddenly at a resistance line. But, that may not eventually portend the real sell entry signal afterward.
About the downside, the trading chart depicts a tougher situation for bears to sustainably stage a come-back in the near sessions. As result, it now calls for a pause in their consideration for a while as long as the current gets no rejection at a higher trading zone. A pit stop may be experienced suddenly at a resistance line. But, that may not eventually portend the real sell entry signal afterward.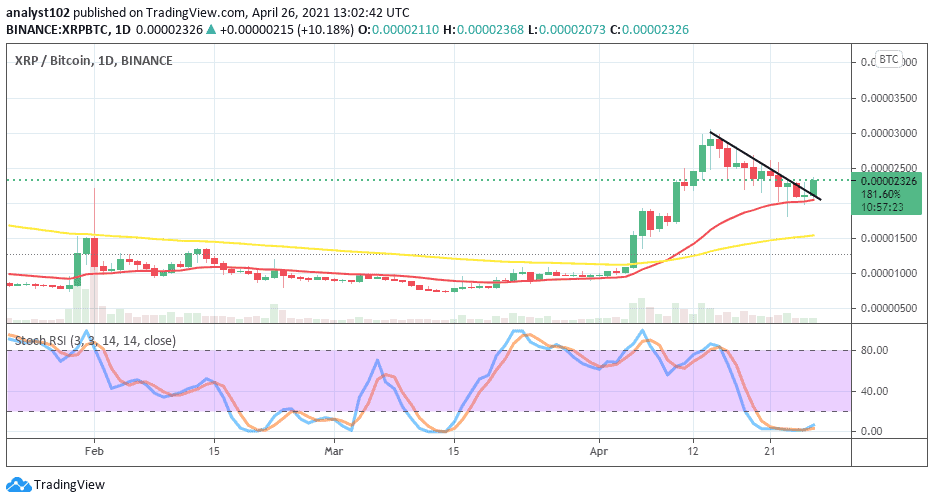
XRP/BTC Price Analysis
On the matter of comparative purchasing status in the field of cryptos trading between XRP and BTC, the chart still reveals that the trend is in control of the base instrument as paired with its counter trading tool. The XRP market’s value is now reversing after it moved in correction down to touch the smaller SMA. The 50-day SMA indicator is located underneath the 14-day SMA trend-line. The Stochastic Oscillators are in the oversold region with conjoined hairs to now attempt to open it towards the north. That gives a signal that the base trading is on a higher probability of getting to push against the counter crypto’s purchasing power.
Join Our Telegram channel to stay up to date on breaking news coverage