Join Our Telegram channel to stay up to date on breaking news coverage
LTC Price Prediction – April 26
The price of Litecoin is currently changing hands at $35.81 as the technical indicator moves above the oversold zone.
LTC/USD Market
Key Levels:
Resistance levels: $285, $295, $305
Support levels: $190, $180, $170
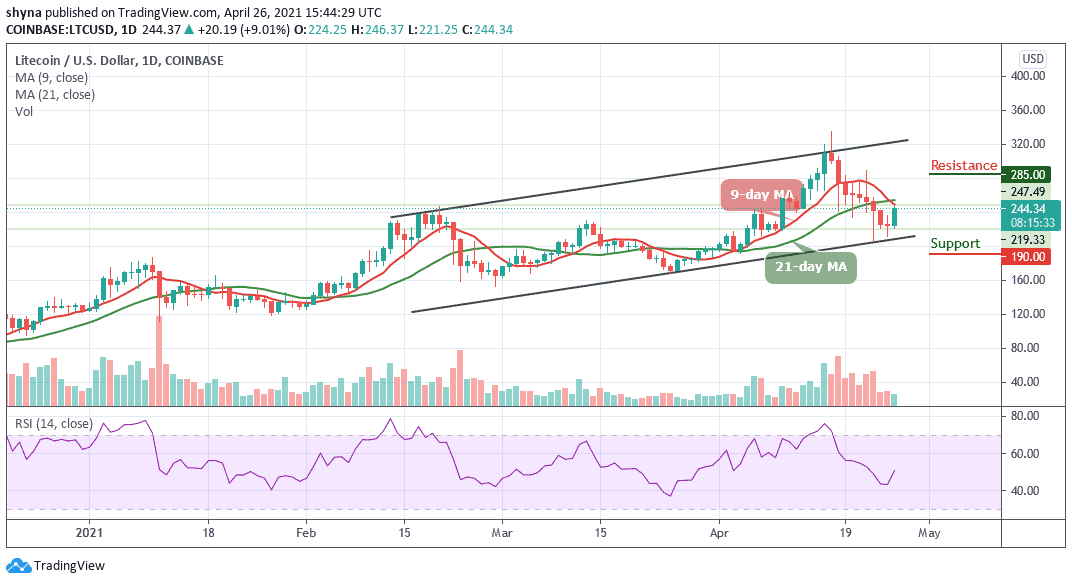
In the past few weeks, LTC/USD has been hit with several downtrends as the coin fell through multiple support levels, eventually hitting a low of about $207. Today, Litecoin has been working on its recovery and at the time of writing, the LTC price is hovering at $244.34, with 9.01% in the green. However, LTC/USD was trapped on the negative side where the bullish rally has failed to materialize several times.
Where is LTC Price Going Next?
The Litecoin (LTC) is yet to clear the hurdles towards the resistance level of $250. Instead, the bears are trying to force their way back to the $220 support level. A break below the $200 support level may provoke an even deeper decline towards the $190, $180, and $170 support levels. Looking at the RSI (14), Litecoin may exhibit the tendencies to follow an upward trend as the coin is still moving above 45-level.
However, if bulls can gather enough strength and push the market above the 9-day and 21-day moving averages within the channel, then the price may likely hit the resistance levels of $285, $295, and $305 respectively. Therefore, further movement above these key resistance levels should, therefore, encourage more buying in the next positive moves.
Meanwhile, against Bitcoin, Litecoin price is making an attempt to cross above the 9-day moving average in other to reach the resistance at 5000 SAT. Unless this resistance is effectively exceeded and the price ends up closing above it, there might not be any reason to expect the long-term bullish reversal.
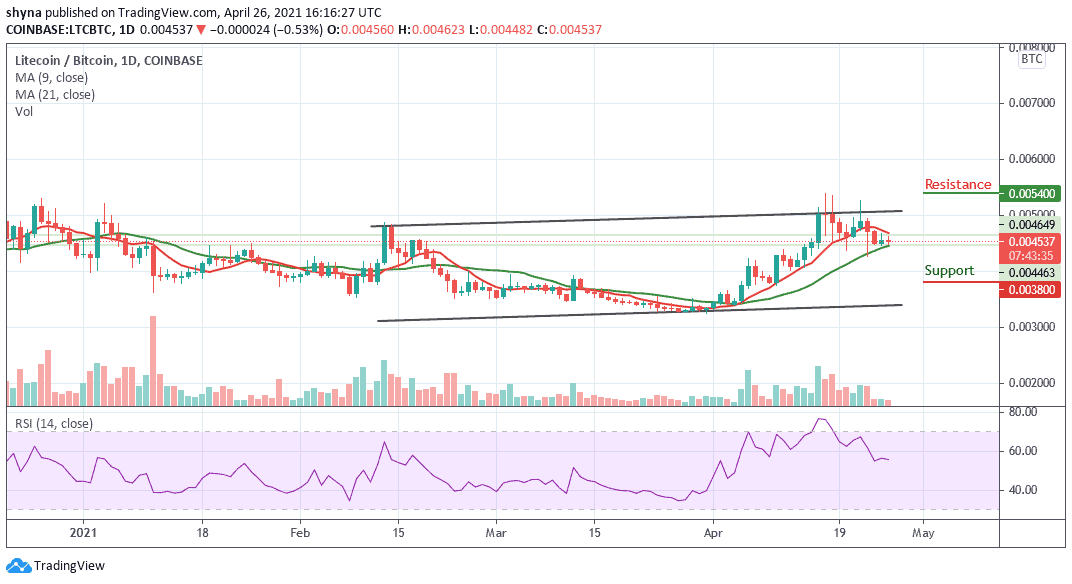
However, trading below the moving averages could refresh lows under 4200 SAT and a possible bearish continuation may likely meet the major support at 4000 SAT before falling to 3800 SAT and below while the buyers may push the coin to the potential resistance at 5400 SAT and above. More so, the technical indicator RSI (14) moves below 60-level, suggesting sideways movement.
Join Our Telegram channel to stay up to date on breaking news coverage