Join Our Telegram channel to stay up to date on breaking news coverage
Bitcoin (BTC) Price Prediction – September 17
At the opening of the market today, BTC/USD surged and topped at a new daily high of $11,044 but now retracing below $10,900.
BTC/USD Long-term Trend: Ranging (Daily Chart)
Key levels:
Resistance Levels: $11,600, $11,800, $12,000
Support Levels: $10,250, $10,050, $9,850
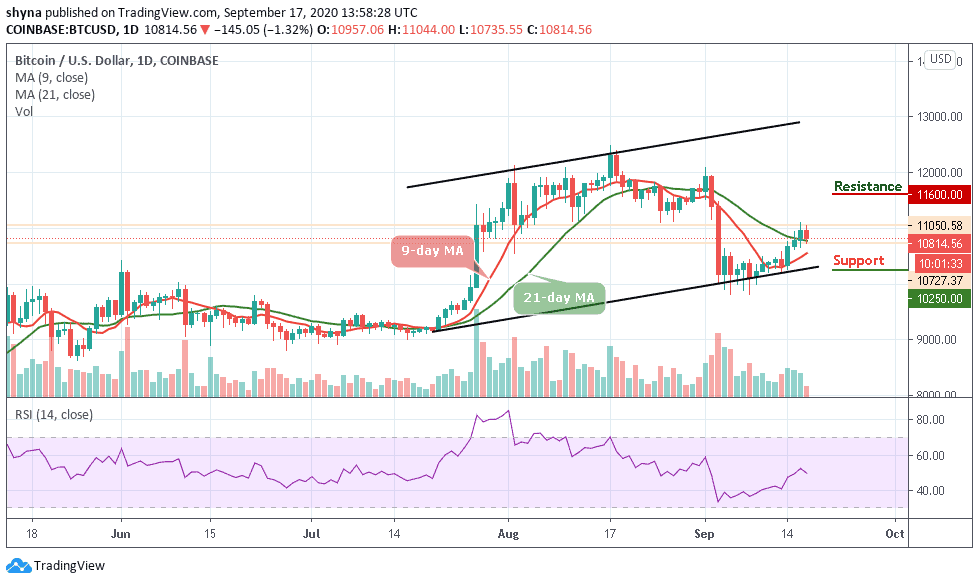
After a consecutive three bullish days, BTC/USD jumped and touched a key resistance of $11,044 but fails to further higher as the coin is now trading towards the south. Nevertheless, if BTC/USD continued to consolidate in this way, traders may see it break through the 21-day moving average and it would then be obvious to target $10,600. Traders may also see a larger decline over the next two days if the downtrend continues to drop below the 9-day moving average.
What to Expect from Bitcoin (BTC)
If the Bitcoin price fails to continue its upward move above the $11,000 level, it could further correct lower, which means initial support on the downside is near the lower boundary of the channel at $10,500. However, a further downside break below this level may perhaps start an extended decline towards the $10,200 support level and any further losses could negate the chances of a strong rally this week and the price might continue lower towards $10,250, $10,050, and $9,850 supports.
Meanwhile, the market may remain in the consolidation mode above the 21-day moving average, deciding on the next move. However, the market may continue to sell should in case the declines come together. But, if the bulls show a strong commitment, BTC/USD could rise to the critical resistance levels of $11,600, $11,800, and $12,000. The RSI (14) indicator, though on the negative side may be giving fade bullish signals.
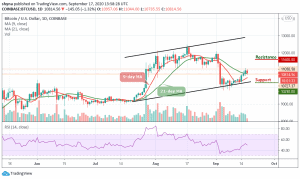
BTC/USD Medium-Term Trend: Bullish (4H Chart)
On the 4-hour chart, BTC/USD Rejection at $11,044 could eventually lead to declines to the critical support between $10,700 and $10,600. To conclude, it is possible that the bounce which began on September 13 has ended and BTC/USD has begun a downward move that could take it towards $10,000.

Meanwhile, in case the Bitcoin price continues to fall as the RSI (14) moves below 60-level, BTC/USD can rely on the short-term support levels at $10,500 and $10,300. Alternatively, if it decisively overcomes the $11,000 resistance, the next resistance levels lie at $11,200 and $11,400 respectively.
Join Our Telegram channel to stay up to date on breaking news coverage