Join Our Telegram channel to stay up to date on breaking news coverage
Bitcoin (BTC) Price Prediction – September 13
The Bitcoin price falls back below $10,300 level in the last few hours, after bears overpowered a second breakout attempt from the current range.
BTC/USD Long-term Trend: Ranging (Daily Chart)
Key levels:
Resistance Levels: $11,200, $11,400, $11,600
Support Levels: $9,400, $9,200, $9,000
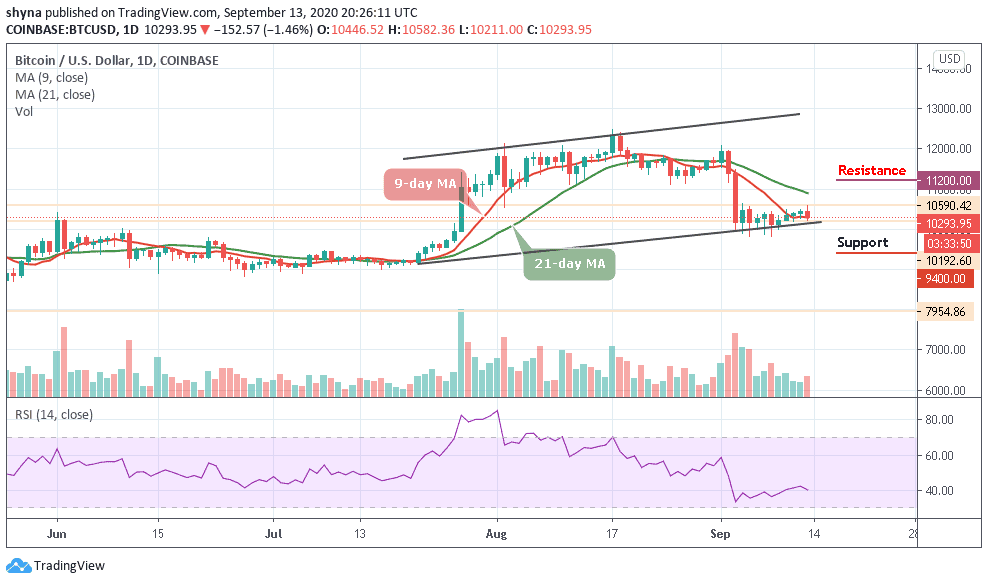
BTC/USD fails to break the daily high of $10,582 as it fails to touch the daily low at $10,211 level. The Bitcoin (BTC) started the day off by trending above the 9-day moving average inside the ascending channel but now fails to continue the bullish movement.
What to Expect from Bitcoin (BTC)
However, if the coin remains below the moving averages, the first level of support is located at $10,000. Beneath this, further support lies at $9,400, $9,200, and $9,000 levels. Moreover, a break above 21-day MA would have set Bitcoin up to reach the $11,000 level; however, this is looking less and less likely with each failed breakout attempt as the RSI (14) moves to cross below 40-level.
In other words, BTC/USD is currently sliding below the 9-day MA and if care is not taken, the coin may likely fall below the lower boundary of the channel. Although the candle is still yet to close, however, it does look unlikely that the bulls may end up closing above this barrier should in case the technical indicator moves above 45-level. Meanwhile, if the coin follows the uptrend, the potential resistance lies at $11,200, $11,400, and $11,600.
BTC/USD Medium-Term Trend: Ranging (4H Chart)
Looking at the 4-hour chart, the bears are coming back into the market tremendously while the bulls failed to defend the $10,500. Nevertheless, the $10,100 and below may come into play if the bearish momentum increases in the markets.
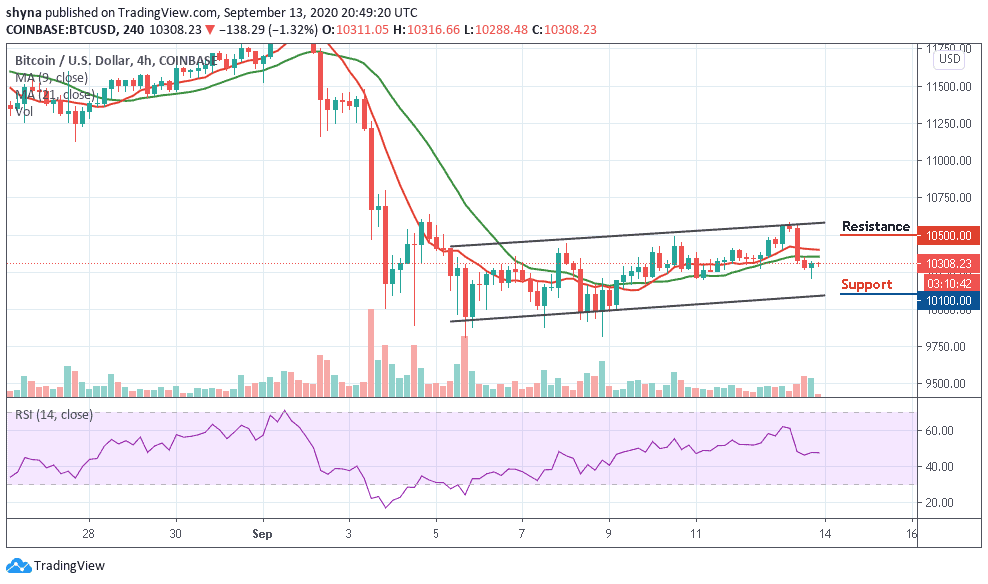
However, if the buyers hijack the current movement and power the market again, traders may expect a retest at the $10,400 resistance level; breaking this level may further allow the bulls to hit the $10,500 and above. At the moment, the RSI (14) signal line is seen moving in the same direction above the 45-level, suggesting the continuation of sideways movement.
Join Our Telegram channel to stay up to date on breaking news coverage