Join Our Telegram channel to stay up to date on breaking news coverage
Bitcoin (BTC) Price Prediction – September 9
The Bitcoin price remains above $10,000 while most crypto assets are in the red.
BTC/USD Long-term Trend: Ranging (Daily Chart)
Key levels:
Resistance Levels: $11,000, $11,200, $11,400
Support Levels: $9,100, $8,900, $8,700
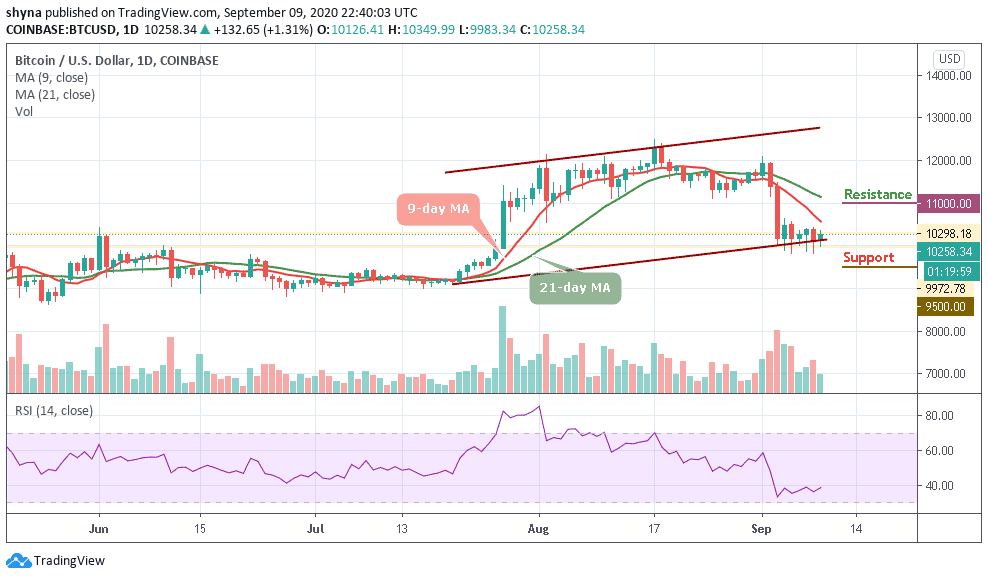
BTC/USD is slightly in the green after adjusting from the short term support at $9,983. On the upside, BTC/USD was rejected at $9,700 during the weekend session. The price is currently above $10,000 but buyers have eyes on the first key hurdle at $10,300 and later the grand prize of trading above the coveted $10,500.
Where is BTC Price Going Next?
From a technical perspective, can traders really say Bitcoin (BTC) is back into the hands of the bulls? The technical indicator RSI (14) has embraced support below the 40-level. If the indicator can continue with the upward trend, the price could also push towards $10,400. On the other hand, the gap between the 9-day moving average and the 21-day moving average suggests that the upward movement is yet to come into play in the coming sessions.
Nevertheless, BTC/USD is settling in a tight range limited by $9,800 on the downside and $10,300 on the upside. If the market price breaks above the moving averages, BTC/USD may likely hit the potential resistance levels at $11,000, $11,200, and $11,400 while the supports are located below the lower boundary of the channel at $9,500, $9,300, and $9,100 respectively.
BTC/USD Medium – Term Trend: Bearish (4H Chart)
Looking at the 4-hour chart, BTC/USD is seen following a downward move above the 9-day and 21-day moving averages. However, the coin may continue to depreciate if the $10,000 support is broken one more time. This may likely cause the Bitcoin price to fall below the moving averages which may likely reach the critical supports at $9,800, $9,600, and $9,400 respectively.
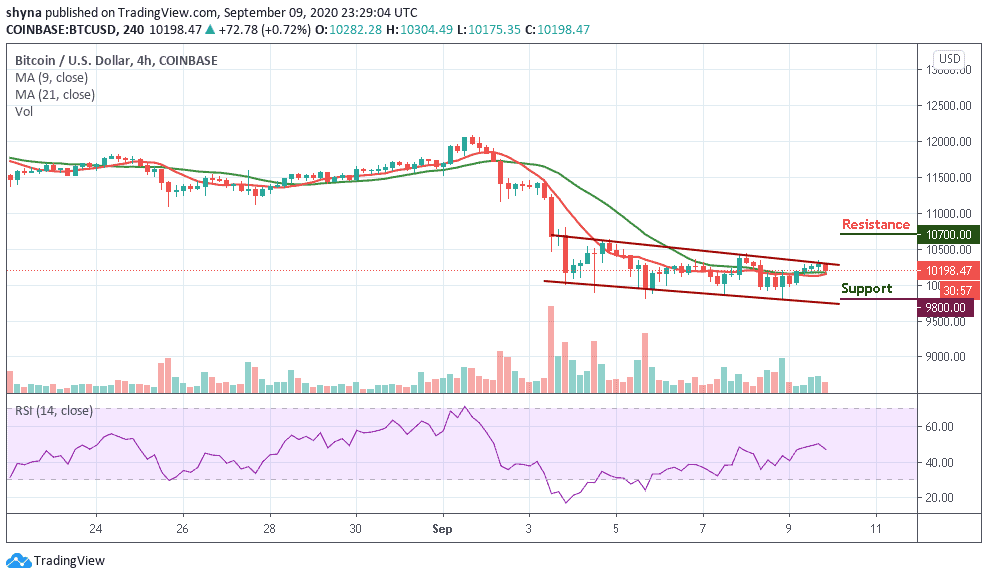
On the other hand, if the bulls regroup and hold the current price tight, BTC/USD may likely cross above the upper boundary of the channel to hit the potential resistance at $10,700, $10,900, and $11,100 levels as the technical indicator RSI (14) moves around 48-level, which may likely give additional bullish signals.
Read more:
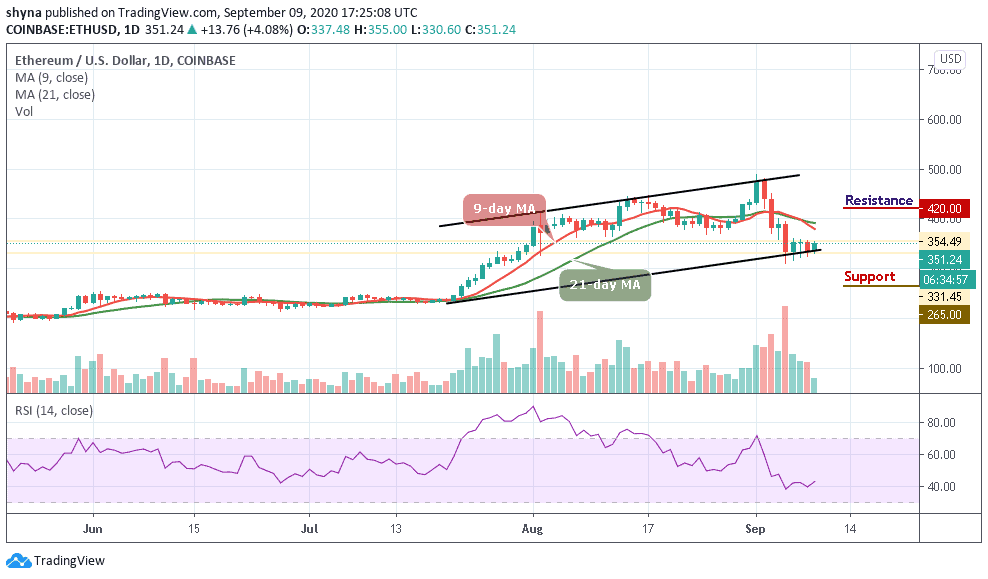
- Ethereum Price Prediction: ETH/USD Could Resend the Market Price Above $380
- Bitcoin Cash Gets Proposal To Add Dev Tax With New Software Upgrade
Join Our Telegram channel to stay up to date on breaking news coverage