


Join Our Telegram channel to stay up to date on breaking news coverage
Bitcoin (BTC) Price Prediction – December 16
At the time of this writing, the price of Bitcoin is slightly above $20,340, having reached an intraday high of $20,420.
BTC/USD Long-term Trend: Bullish (Daily Chart)
Key levels:
Resistance Levels: $20,800, $21,000, $21,200
Support Levels: $17,800, $17,600, $17,400
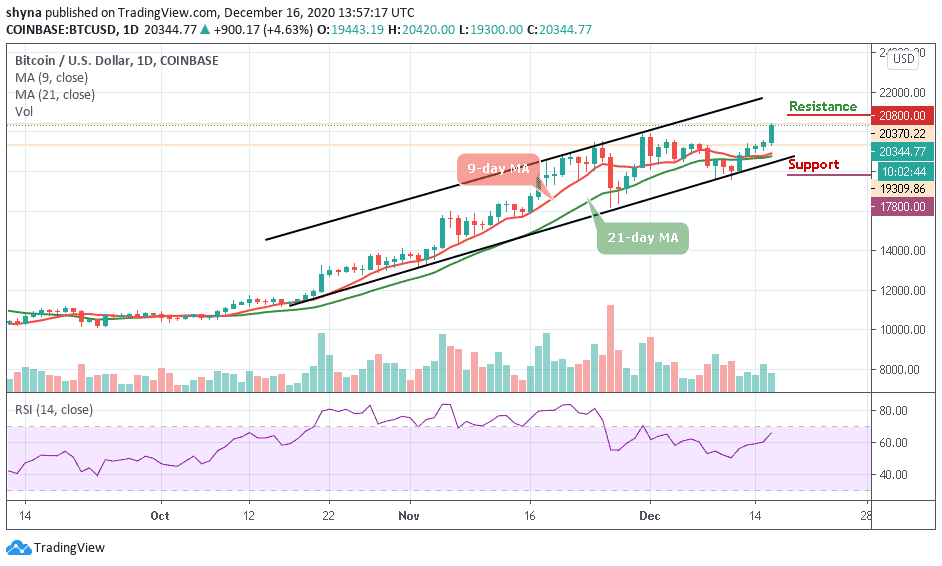
BTC/USD is on its way up and it seems that there is nothing holding it back from reaching the higher level. After a tumultuous day of trading today, the coin has just painted another high for this year 2020 as it is currently trading at $20,344. The Bitcoin price spiked above $20,000 again as the market remains above the 9-day and 21-day moving averages.
What to Expect from Bitcoin (BTC)
Bitcoin bulls are currently trading comfortably towards the upper boundary of the channel as the price establishes additional bullish signals. However, the long-term outlook now favors the bulls, given the daily close produced a large bullish engulfing candle with eyes now set on the daily resistances at $20,800, $21,000, and $21,200 respectively.
However, any rejection at the current market value could eventually lead to the supports below the moving averages. In case BTC drops and touches $18,500 support, then the coin can rely on the long-term support levels at $17,800, $17,600, and the psychological $17,400. Alternatively, the technical indicator RSI (14) is seen moving into the overbought region, suggesting more bullish signals.
BTC/USD Medium-term Trend: Bullish (4H Chart)
According to the 4-hour chart, the Bitcoin price is seen touching the daily high at $20,822. However, today’s price move happens to be the most impressive one as it climbs above the long-awaited resistance level of $20,500 with a sharp upsurge. In addition, BTC/USD is now maintaining its bull-run as the technical indicator RSI (14) moves into the overbought region once again.
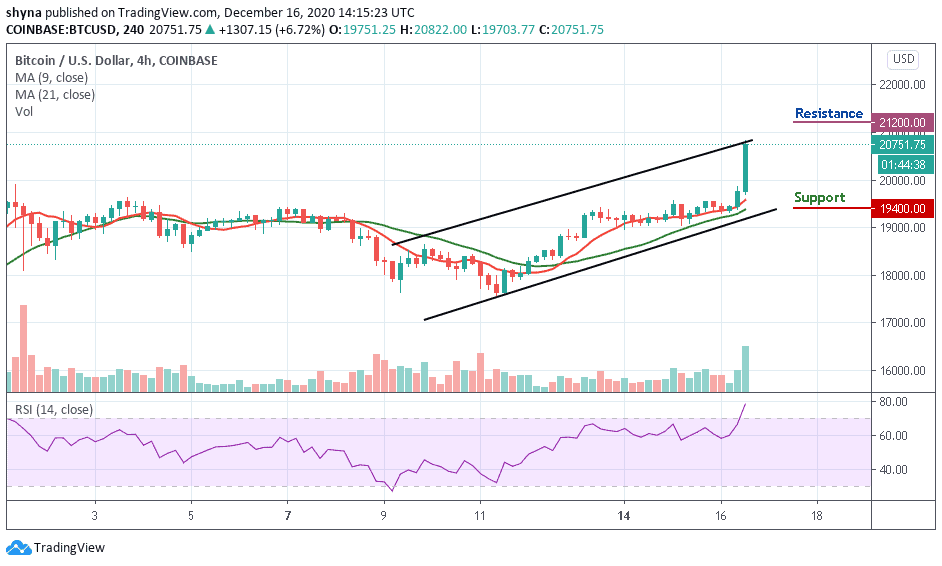
Above the said price mark, BTC may take a downward move if the bulls failed to push the price higher again. Therefore, the coin may breach the major support near $19,800 and could reach another support at $19,400 and below. Nevertheless, if the bulls find a decent resistance level of around $20,800, the coin may continue its recovery by crossing above the channel to hit the resistance at $21,200 and above.
Read more:
- Ethereum Price Prediction for Today, July 25: ETH Slides Below $1600
- Litecoin Price Prediction: LTC/USD May Decline to Test the Support Level of $44
Join Our Telegram channel to stay up to date on breaking news coverage
