Join Our Telegram channel to stay up to date on breaking news coverage
Bitcoin (BTC) Price Prediction – November 4
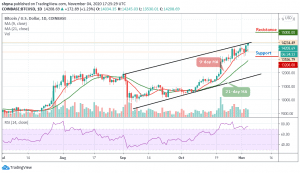
At the time of this writing, Bitcoin is trading slightly above $14,208, having reached an intraday high of $14,245.
BTC/USD Long-term Trend: Bullish (Daily Chart)
Key levels:
Resistance Levels: $15,000, $15,200, $15,400
Support Levels: $13,200, $13,000, $12,800
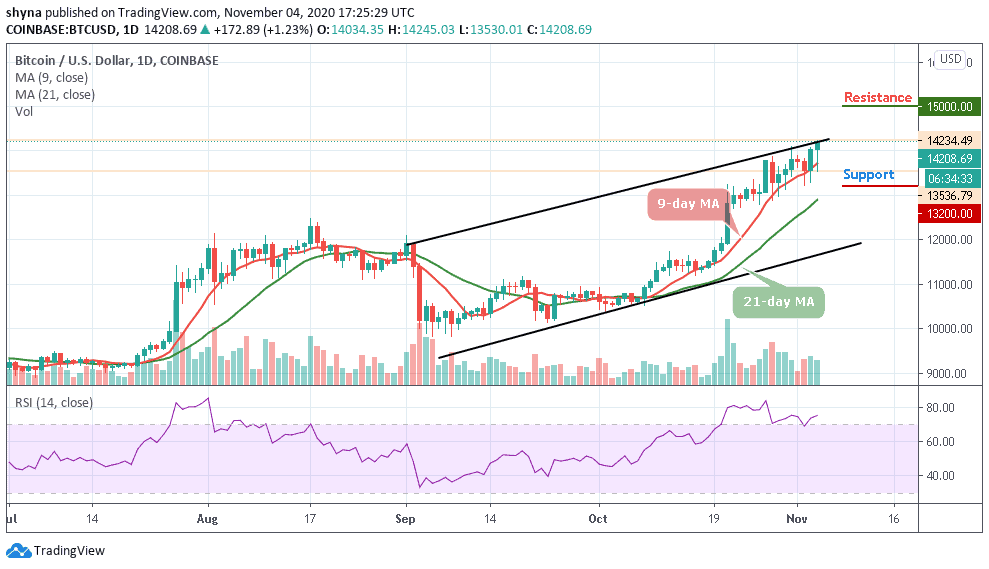
BTC/USD is on a steady way up and it seems that there is nothing holding it back from reaching the higher level. After a tumultuous day of trading today, the coin has just painted a new high for 2020 as it is currently trading at $14,208. The Bitcoin price spiked above $14,000 again and erased most of yesterday’s losses, and the market remains above the 9-day and 21-day moving averages. Although the coin dipped below $13,300 on two occasions at the beginning of this month it started recovering yesterday jumping above $13,500 and stayed above it for most of the past 24 hours.
Will BTC Break above $14,500 Resistance or Reverse?
BTC/USD bulls are currently trading comfortably around the upper boundary of the channel as the price establishes a new bullish signal. However, the long-term outlook now favors the bulls, given the daily close produced a large bullish engulfing candle with eyes now set on the daily resistances at $15,000, $15,200, and $15,400 respectively.
However, rejection at $14,000 could eventually lead to declines to the critical support below the moving averages at $13,800. In case BTC drops and touches the low of $13,500 support, then the coin can rely on the long-term support levels at $13,200, $13,000, and the psychological $12,800. Alternatively, the technical indicator RSI (14) is seen moving within the overbought region, suggesting more bullish signals.
BTC/USD Medium-term Trend: Bullish (4H Chart)
According to the 4-hour chart, the Bitcoin price is seen touching the daily high at $14,273. However, today’s price move happens to be the most impressive one as it climbs above the long-awaited resistance level of $14,200 with a sharp upsurge. More so, BTC/USD is now maintaining its bull-run above $14,150 as the RSI (14) moves above 60-level.
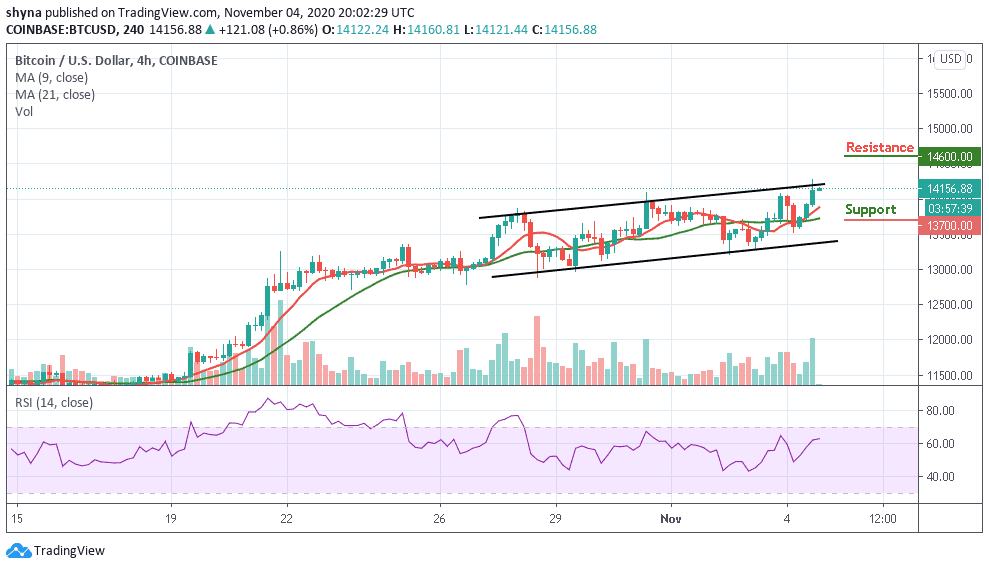
Above the said price mark, BTC may take a downward move if the bulls failed to push the price higher again. Therefore, the coin may breach the major support near $14,000 and could reach another support at $13,700 and below. Nevertheless, if the bulls find a decent resistance level around $14,400, the coin may continue its recovery by crossing above the channel to hit the resistance at $14,600 and above.
Join Our Telegram channel to stay up to date on breaking news coverage