Join Our Telegram channel to stay up to date on breaking news coverage
Bitcoin (BTC) Price Prediction – October 13
BTC bulls have stayed in control since last week (October 7), taking the price up from $10,546 to $11,561 as of this morning.
BTC/USD Long-term Trend: Bullish (Daily Chart)
Key levels:
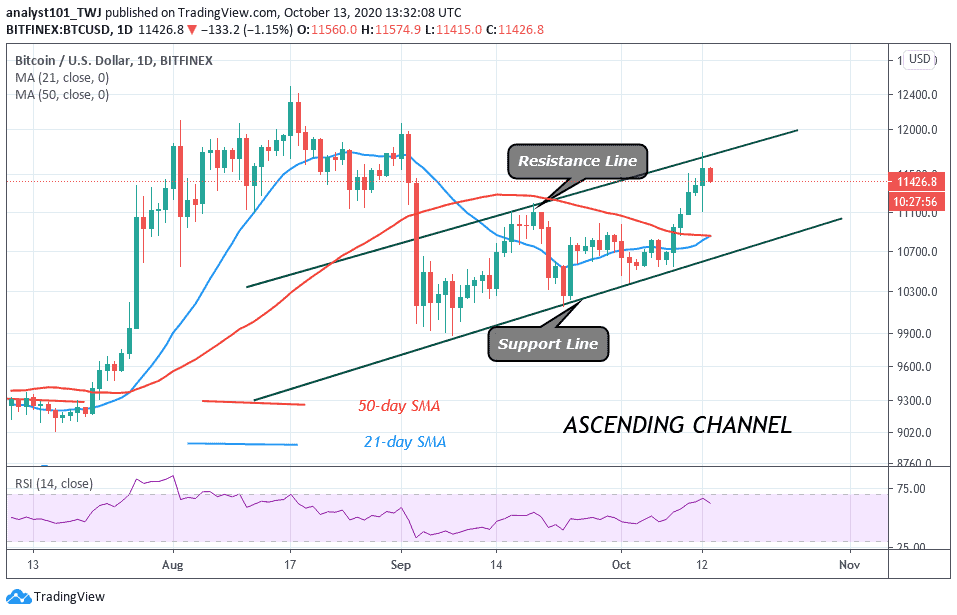
Resistance Levels: $12,000, $12,200, $12,400
Support Levels: $11,000, $10,800, $10,600
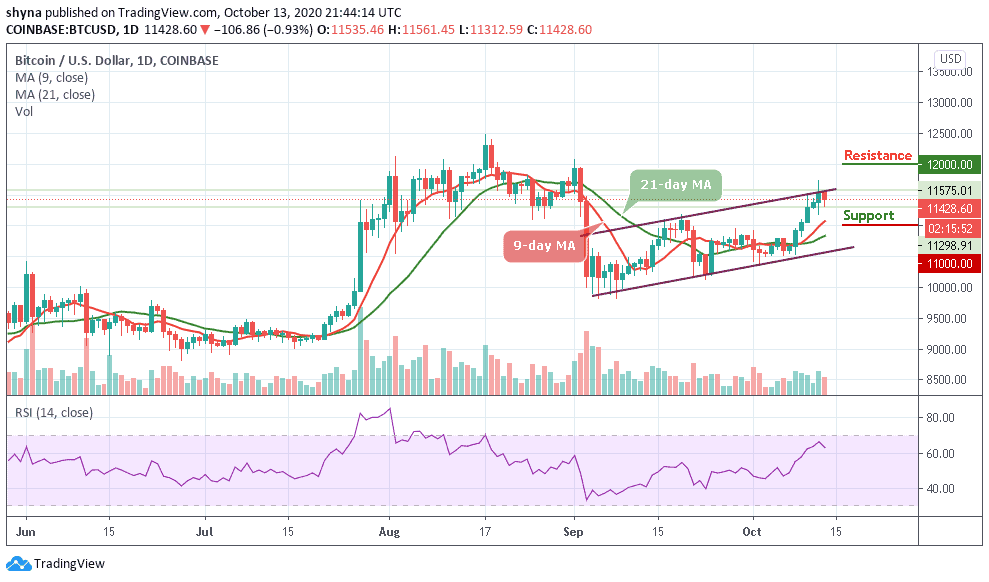
BTC/USD is currently trading at $11,428 after a robust and renewed daily uptrend that touches the daily high of $11,561. This time, the Bitcoin price did not react positively; however, we know the cause of the recent setback. The dollar index has strengthened and Bitcoin has an inverse correlation with it. On the daily chart, the price of Bitcoin has managed to remain above the 9-day and 21-day moving averages, turning both into support levels.
What to Expect from Bitcoin (BTC)
According to the daily chart, despite this strong upward movement, the price is currently facing rejection at the $11,561 resistance level. While the technical indicator RSI (14) shows sustained bullish momentum but it looks like this level has been strong enough to absorb an immense amount of buying pressure as the signal line is seen nose-diving below 66-level. The resistance levels to watch for are $12,000, $12,200, and $12,400.
However, there are several possible areas that should help bring up BTC/USD if the bears take back control of the asset. The $11,250 and $11,150 will be the first levels to observe if a downtrend begins. From there, we have the first main support zone, which sits around $11,000 and additional supports may be found at $10,800 and $10,600 respectively.
BTC/USD Medium-term Trend: Bullish (4H Chart)
On the 4-hour chart, BTC/USD touches a high of $11,561 after the price breaks above the 9-day and 21-day moving averages. However, as the technical indicator RSI (14) moves to cross above the 60-level, the upward move may be facing the resistance above the recent high.
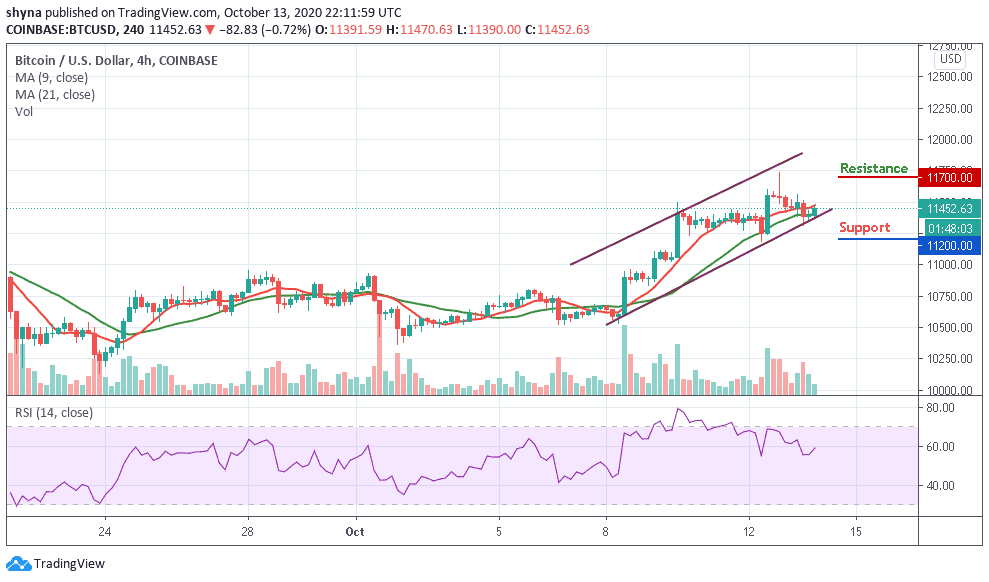
Meanwhile, on the downside, if the market price retraces and breaks below the moving averages within the ascending channel, the coin may further depreciate to the support of $11,200 and below. In other words, if the price retraces and finds another resistance above the moving averages, the uptrend could continue into the previous highs to hit the resistance at $11,700 and above.
Join Our Telegram channel to stay up to date on breaking news coverage