Join Our Telegram channel to stay up to date on breaking news coverage
Bitcoin (BTC) Price Prediction – October 13, 2020
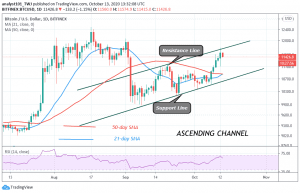
BTC/USD faces rejection after reaching a high of $11,740. BTC price has fallen to the range-bound zone. Today, the king coin is trading at $11,389 after the resistance at the recent high.
Resistance Levels: $10,000, $11, 000, $12,000
Support Levels: $7,000, $6,000, $5,000

Since October 10, Bitcoin has resumed a range-bound movement between $11,200 and $11,450. Yesterday, the bulls broke the range-bound movement as buyers attempt to reach the previous highs. Buyers pushed BTC to the high of $17,400 but faced immediate rejection at the recent high. The crypto has fallen to the price range of $11,200 and $11,450.
The crypto fell above the critical support zones for the continuation of the upside momentum. BTC has resumed a fresh upward move to retest the $12,000 and $12,400 overhead resistances. The price has risen above $11,400, a strong bounce above the current support will propel price to break the resistance at $11,500 and $11,700. Meanwhile, the coin is above the 80% range of the daily stochastic. It indicates that the coin is in the overbought region of the market.
Bank of England Governor acknowledges Bitcoin as little “Intrinsic Value “
Andrew Bailey is the Governor of Bank of England who has spoken about Bitcoin having an intrinsic value. According to him: “It may have extrinsic value in the sense that people want it” “I have to be honest, it is hard to see that Bitcoin has what we tend to call intrinsic value,” said Bailey. “It may have extrinsic value in the sense that people want it.” The Governor indicated that he is always nervous when people use it as payment. Besides, he indicated that people should be aware of the asset’s volatility when it came time to invest.
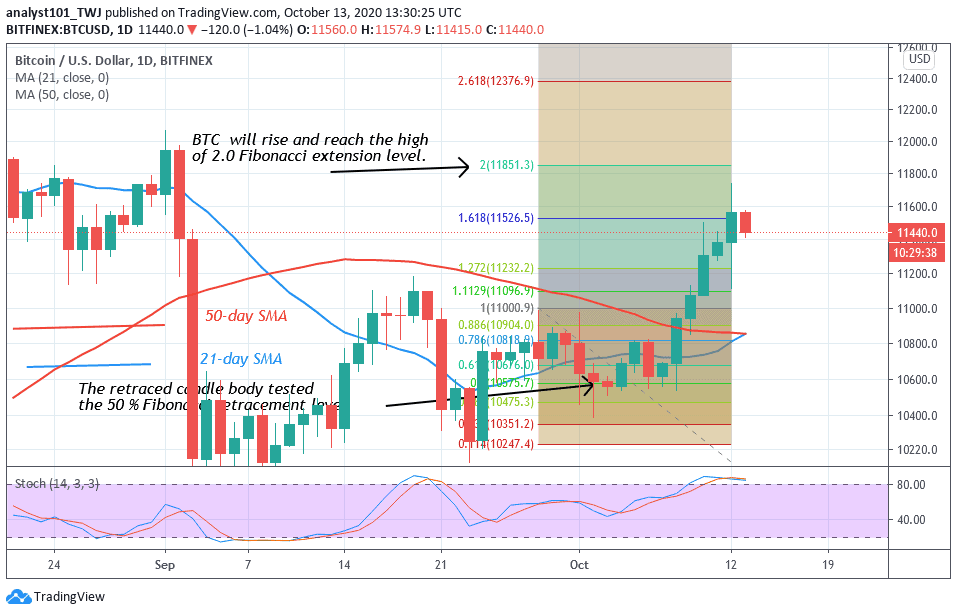
Bitcoin is fluctuating in the price range between $11,200 and $11,450. The Fibonacci has indicated a further upward movement of the coin. On September 29 uptrend; the coin was resisted at $10,880. The retraced candle body tested the 50% Fibonacci retracement level. It indicates that the coin will rise and reach level 2.0 Fibonacci extension level.
Join Our Telegram channel to stay up to date on breaking news coverage