Join Our Telegram channel to stay up to date on breaking news coverage
Bitcoin (BTC) Price Prediction – October 6
Bitcoin drops heavily today as the cryptocurrency breaks beneath $10,600 and heads toward $10,500.
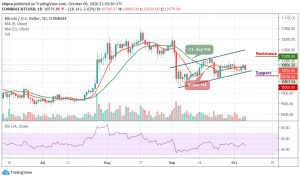
BTC/USD Long-term Trend: Bullish (Daily Chart)
Key levels:
Resistance Levels: $11,200, $11,400, $11,600
Support Levels: $10,300, $10,100, $9,900

BTC/USD is seen dropping with a sharp loss of 2.02% today as the cryptocurrency falls beneath the $10,600 support level to reach the daily low at $10,524. However, the daily chart reveals that $10,800 is a very important area as it provided strong resistance for the market during yesterday’s trading; therefore, it is expected to provide strong support moving forward.
What to Expect from Bitcoin (BTC)
BTC/USD is now trading below the 9-day and 21-day moving averages at support provided by a rising support trend line of the channel; however, a break of this trend line could cause Bitcoin to unwind toward the $10,500 level. Meanwhile, the cryptocurrency is in a critical position right now with the next few days dictating the direction that it will head over the next 2 weeks. A drop beneath $10,400 could be detrimental to Bitcoin as it would lead the first digital asset towards the supports at $10,300, $10,100, and $9,900.
Moreover, if the buyers can rebound from the current support level at $10,576, the first level of resistance lies at $10,700. Above this, further resistance is expected at $11,000. This may likely follow by the potential resistance at $11,200, $11,400, and $11,600 levels. Therefore, if the coin can break here, then the market may be on the verge of turning bullish in the short term. Presently, the RSI (14) is facing the south, indicating more bearish signals.
BTC/USD Medium-Term Trend: Bearish (4H Chart)
According to the 4-hour chart, BTC/USD has been facing immense turbulence since the beginning of today’s trading, with sellers forcing its price down to the lows of $10,524. If the bulls decide to push the market price back above the 9-day and 21-day moving averages, the coin may likely hit the resistance at $10,800 and above.
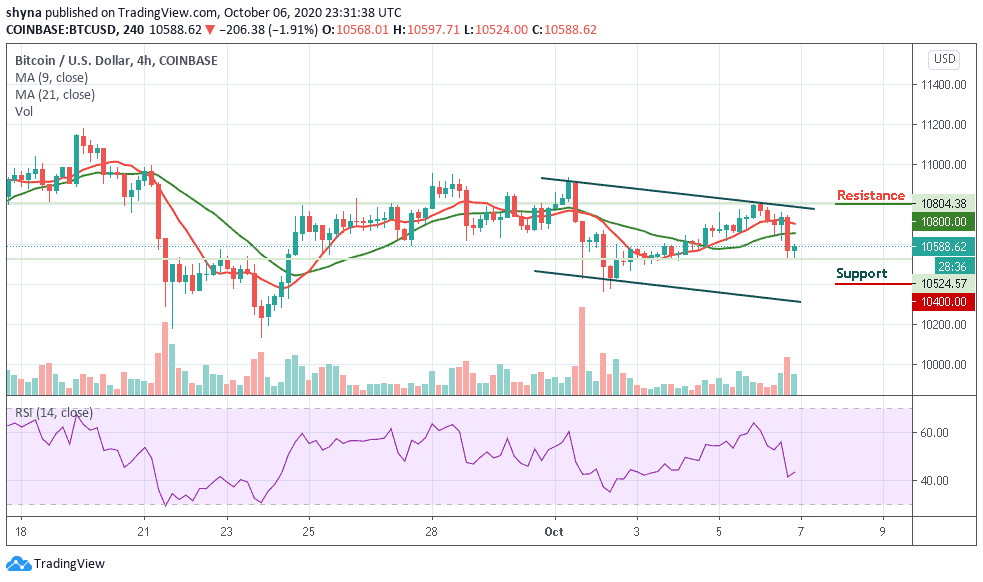
However, it now appears that the cryptocurrency is at risk of seeing further downside in the near-term, as the multiple attempts to shatter its $10,000 support seem to indicate that bears are building momentum. As the RSI (14) remains below the 45-level, the coin may locate the critical supports at $10,400 and below.
Join Our Telegram channel to stay up to date on breaking news coverage