Join Our Telegram channel to stay up to date on breaking news coverage
Bitcoin (BTC) Price Prediction – April 7
The Bitcoin price is back under $57,000 after losing an important trend line that has supported the cryptocurrency’s uptrend.
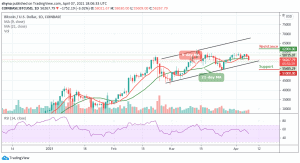
BTC/USD Long-term Trend: Bullish (Daily Chart)
Key levels:
Resistance Levels: $62,000, $64,000, $66,000
Support Levels: $51,000, $49,000, $47,000
After losing momentum above the $58,000, BTC/USD is facing another decline as the coin crosses below the 9-day and 21-day moving averages. The Bitcoin price is seen trading below the $57,500 and $57,000 support levels. However, the Resistance above $60,000 has proven once again too strong for bulls to break, and bears are now pushing the price per coin back down to retest support lower.
Would Bitcoin Go Up or Down?
Despite the risk of losing the uptrend above the moving averages, that doesn’t necessarily mean a downtrend will begin, or that the greater bull market is immediately over. The Bitcoin price continues to follow a sharper uptrend line at one point, and although the 9-day MA is still above the 21-day MA, therefore, no dramatic downside has ever materialized.
Moreover, if the bulls push higher, the first level of resistance is located at $57,500. A sustainable move above $58,000 is needed for the upside to gain traction while the next important resistance may come at $60,500. Further resistance levels could be located around $62,000, $64,000, and $66,000 while the critical supports lie at $51,000, $49,000, and $47,000.
BTC/USD Medium-Term Trend: Ranging (4H Chart)
Looking at the 4-hour chart, the bears are seen coming back into the market as the 9-day MA crosses below the 21-day MA. The break below this crucial barrier caused it to plunge as low as $55,931, with bulls stepping up and guarding against a decline beneath this level. Meanwhile, unless it recaptures $57,000 in the near term, the bears could have the upper hand over the bulls, and BTC/USD may soon reel significantly lower.
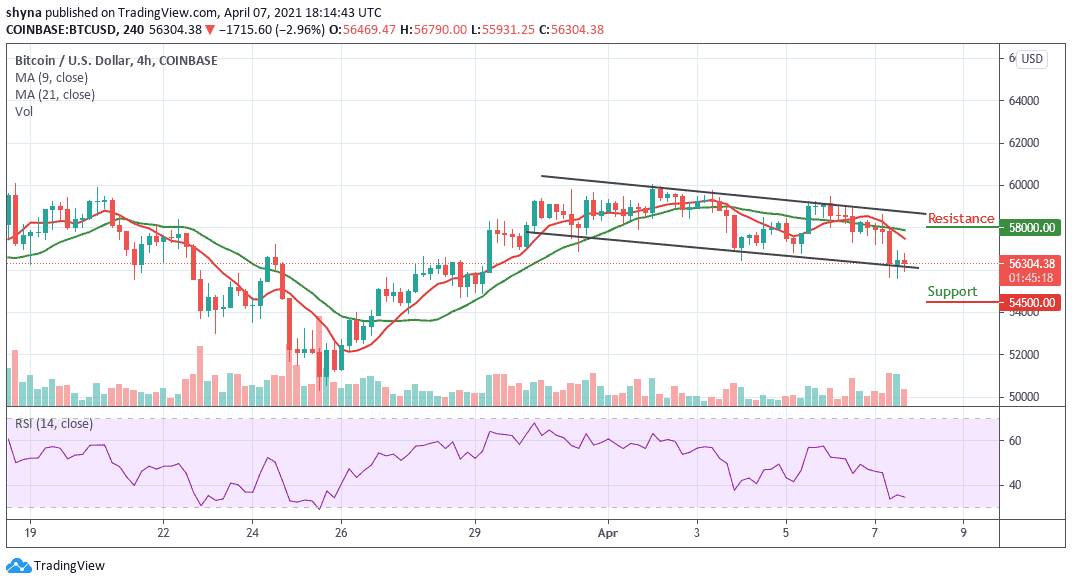
However, any further bearish movements could see the support levels of $54,500 and below. Meanwhile, as the technical indicator RSI (14) moves below 35-level, bearish signals could push the price below the lower boundary of the channel. On the other hand, the resistance levels to watch are $58,000 and above.
Join Our Telegram channel to stay up to date on breaking news coverage