

Join Our Telegram channel to stay up to date on breaking news coverage
Bitcoin (BTC) Price Prediction – March 31
As the daily chart reveals, BTC is showing positive signs and it is likely to accelerate further higher in the near term.
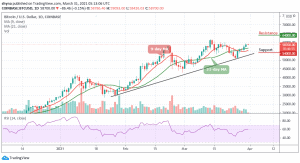
BTC/USD Long-term Trend: Bullish (Daily Chart)
Key levels:
Resistance Levels: $64,000, $66,000, $68,000
Support Levels: $54,000, $52,000, $50,000

BTC/USD may have been stuck in a narrow range between $58,000 and $59,500 as the attempts to hit highs above $60,000 is yet to come into focus. At the time of writing, the Bitcoin price is hovering at $58,700 while facing a bearish building momentum. The Bitcoin price is currently consolidating with a few bearish signals. However, the recent correction to the upward fails near the $59,093 resistance level.
What is the Next Direction for Bitcoin?
If BTC/USD fails to climb above $59,000 and $59,500, there could be more downside corrections. Meanwhile, the $58,500 level may likely be a decent support zone while the next major support is near the $58,000 level. Any further losses might call for a drop towards the $54,000, $52,000, and $50,000 support levels.
However, if there is a clear break to the upside, the Bitcoin price could test the $60,200 resistance level. If the bulls manage to gain strength above this level, there are chances of a decent recovery towards the $62,000 resistance area. Meanwhile, the key breakout zone is near the $64,000, $66,000, and $68,000 resistance levels. But the technical indicator RSI (14) is seen moving around 60-level, suggesting a sideways move into the market.
BTC/USD Medium – Term Trend: Bullish (4H Chart)
The 4-hour chart shows Bitcoin trading at the apex of a rising wedge pattern. This pattern is considered bearish because it forms after a considerable drop in price followed by a minor recovery. Should the price drop below the 9-day and 21-day moving averages; it could reach the nearest supports at $57,000, $55,000, and $53,000.
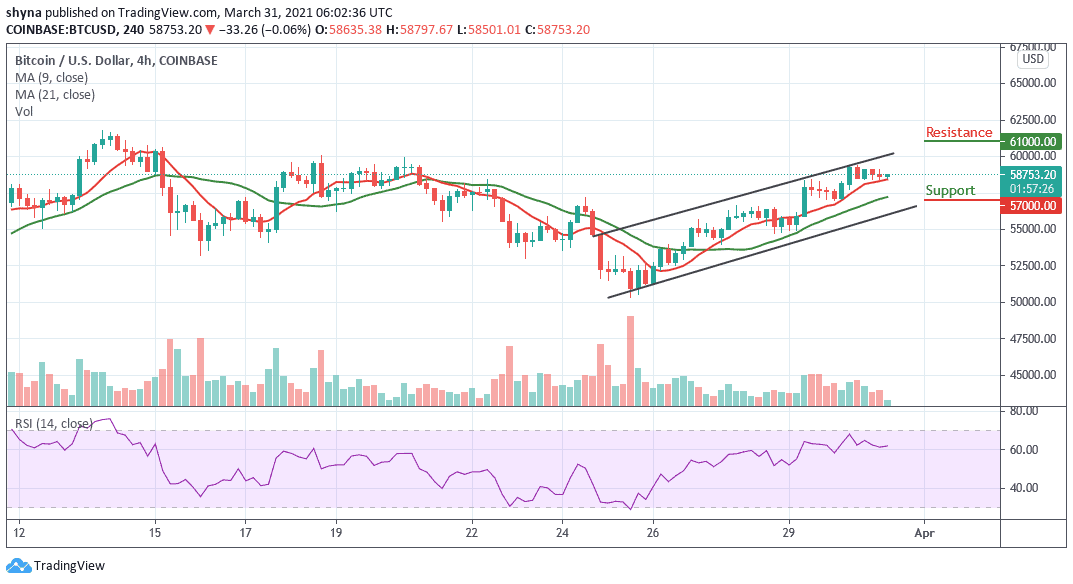
However, if the bulls push the coin above the upper boundary of the channel, it may likely hit the potential resistance levels of $61,000, $63,000, and $65,000. At the moment, the market is indecisive as the RSI (14) indicator moves above 60-level.
Join Our Telegram channel to stay up to date on breaking news coverage
