Join Our Telegram channel to stay up to date on breaking news coverage
ETH Price Prediction – March 30
The Ethereum (ETH) is trading with a 1.52% price hike today as the coin rises to the $1860 level.
ETH/USD Market
Key Levels:
Resistance levels: $2000, $2100, $2200
Support levels: $1650, $1550, $1450

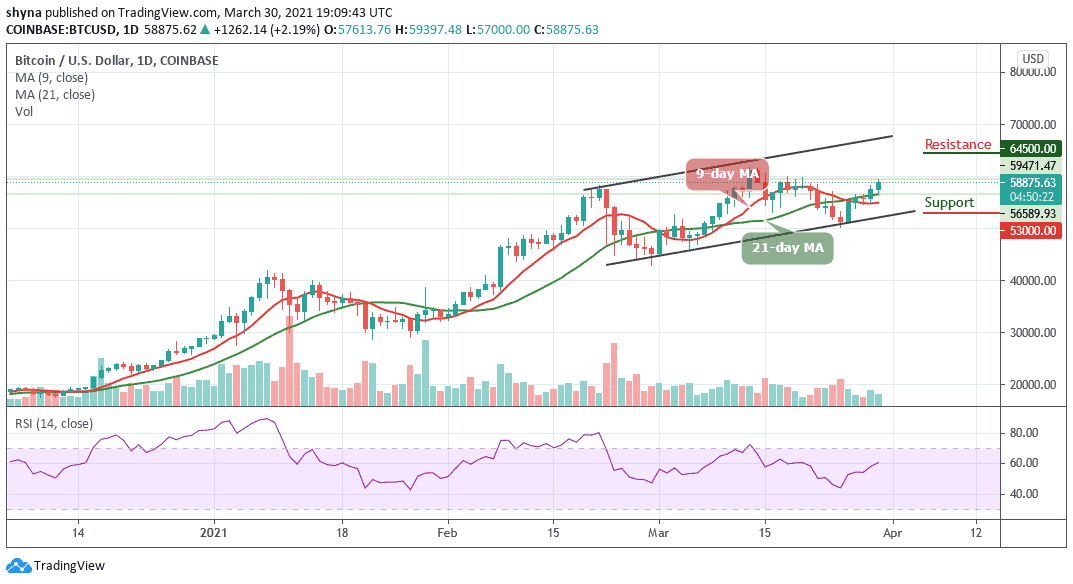
A week ago, ETH/USD was seen trading below the 9-day and 21-day moving averages. Today, the daily chart reveals that the coin pushes higher from the $1815 level as it reached $1860 before coming back to where it is currently trading at $1843. However, it is important to take note that this is not a push from the ETH bulls but rather a result of BTC breaking above $59,000 again.
Where is ETH Price Going Next?
ETH/USD is moving upward, but it still has to face the resistance at $1900 if it wants to continue the upward movement. More so, the Ethereum (ETH) remains in a bullish position despite being predictably rejected from the $1860 level of resistance today. Meanwhile, as long as the world’s second-largest cryptocurrency continues to trade above the moving averages, it presents more of a chance of upside price action, although a break below would signal a new bearish phase in the market.
Furthermore, if the 9-day moving average can cross above the 21-day moving average, traders can expect ETH/USD to consolidate at higher levels. That’s if we could see a further climb above the $1950 which is fast approaching; it may likely reach the resistance at $2000, $2100, and $2200 levels. Meanwhile, the critical support levels are located at $1650, $1550, and $1550 respectively as the technical indicator RSI (14) prepares to cross above 60-level.
Against Bitcoin, Ethereum (ETH) is currently changing hands at 0.0224 BTC following a bearish moment at the time the market opens today. Looking at the daily chart, the current trend of the coin is perpetually looking bearish in the short-term, moving around the 9-day and 21-day moving averages within the channel.
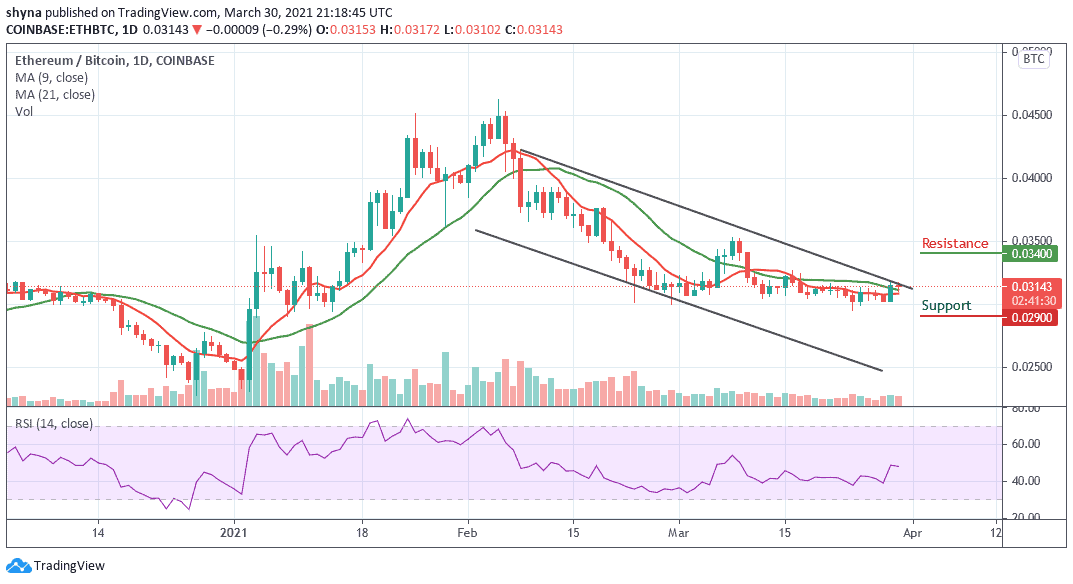
Meanwhile, the potential resistance levels remain at 0.035 BTC and 0.035 BTC while the closest support levels to keep an eye on are 0.029 BTC and critically 0.028 BTC. The RSI (14) is moving below 50-level, which could continue to give more bearish signals in the nearest term.
Join Our Telegram channel to stay up to date on breaking news coverage