Join Our Telegram channel to stay up to date on breaking news coverage
Bitcoin (BTC) Price Prediction – March 30
The Bitcoin price extends its rise above the $59,000 resistance as the coin is now correcting gains.
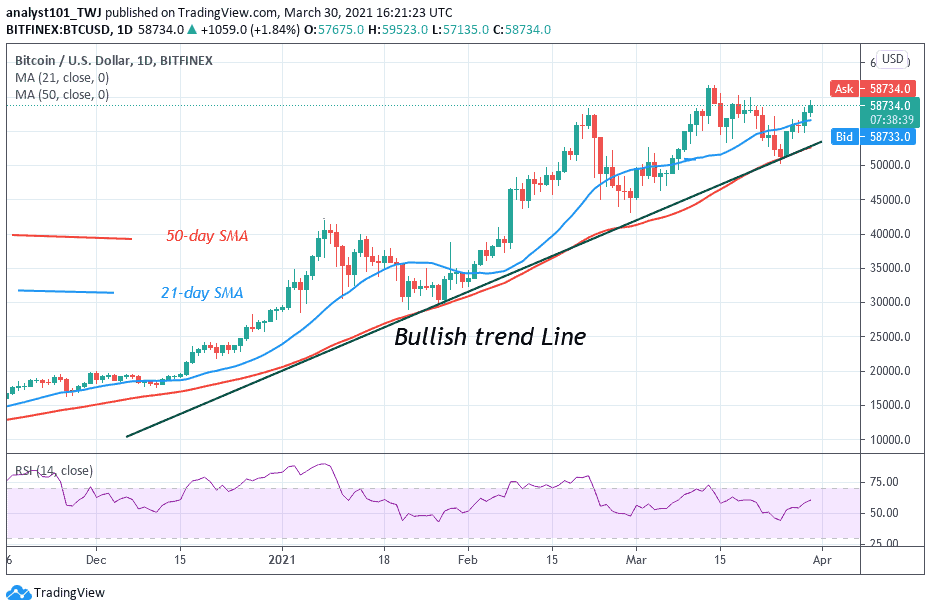
BTC/USD Long-term Trend: Bullish (Daily Chart)
Key levels:
Resistance Levels: $64,500, $66,500, $68,500
Support Levels: $53,000, $51,000, $49,000
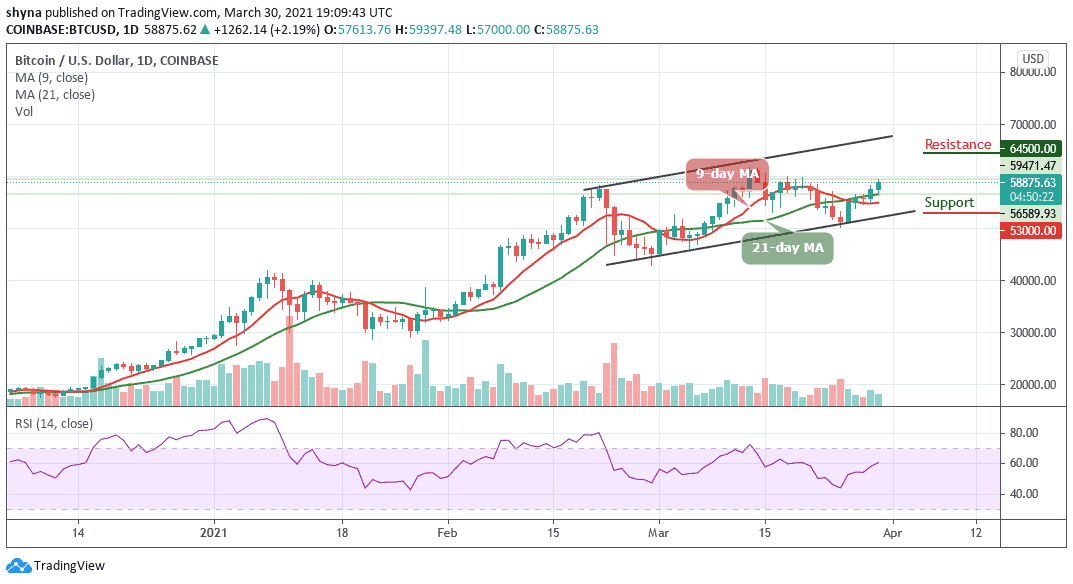
After surpassing the $57,000 resistance, BTC/USD extends its rise and breaks the $58,000 resistance level to settle nicely above the 9-day and 21-day moving averages. Despite the retracement, Bitcoin (BTC) follows a bullish zone and it is likely to continue higher towards $61,000 and $62,000. Moreover, the strong increase in Bitcoin price may not stop there as it could soar to a new all-time high before correcting lower.
Would there Be a Downward Move?
The Bitcoin price is moving steadily in an uptrend and if it fails to climb above $59,000 and $60,000, there could be a downside correction but the $57,500 level could be a decent support zone. Meanwhile, the next major support is near the $56,000 level and a connecting bullish trend line but any movement below the moving averages might call for a drop towards the $54,000 support zone in the near term. Additional supports could be found at $53,000, $51,000, and $49,000.
Furthermore, the daily chart reveals that the Bitcoin bulls are currently dominating the market. However, if the bulls continue to push the market above the recent daily high, then the market price could hit the resistance levels of $64,500, $66,500, and $68,500 respectively. Moreover, as the technical indicator RSI (14) moves above 60-level, further bullish movement may encourage further buying above the upper boundary of the channel.
BTC/USD Medium-term Trend: Bullish (4H Chart)
Looking at the 4-hour chart, if the Bitcoin holds above $60,000, the next level of resistance could be $61,500 along with the significant ascending trend-line. The next resistance would be $62,500, followed by $63,500 and $64,500.
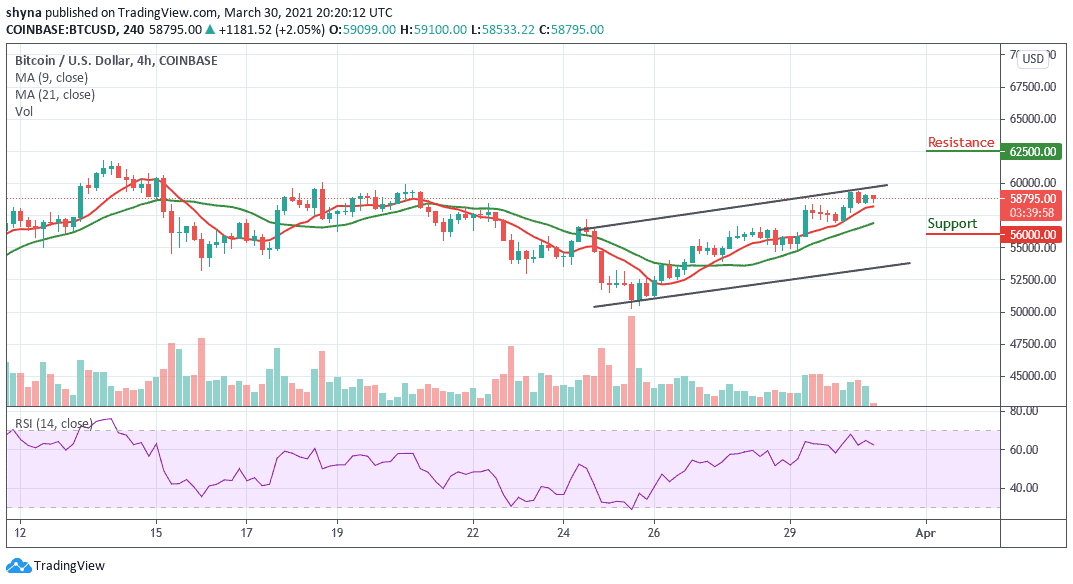
Meanwhile, as the technical indicator RSI (14) moves below the 65-level, this may signal a temporary end to the current bullish trend. However, the indicator is encountering the crucial higher lows trend-line. If it fails to find support here, then traders can expect the correction to get even deeper, which may likely reach the support levels of $56,000, $54,000, and $52,000 respectively.
Join Our Telegram channel to stay up to date on breaking news coverage